To
Contents
To Previous Page
To Next Page
To Publications Page
To Home Page
To
Contents
To Previous Page
To Next Page
To Publications Page
To Home Page

National Drug Intelligence Center |
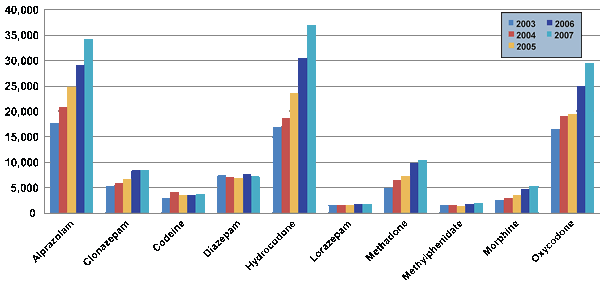
CPDs are diverted for nonmedical use. Law enforcement reporting and statistical data indicate that CPD diversion nationwide increased overall from 2004 through 2007. According to the National Forensic Laboratory Information System (NFLIS),16 the estimated number of diverted CPDs analyzed by state and local laboratories nationwide increased for most of the commonly diverted and abused prescription opioid pain relievers and benzodiazepines from 2003 through 2007, the latest year for which such data are available. (See Figure 4.) The highest percentage increases for the 5-year period were for the prescription opioid pain relievers hydrocodone (118%), morphine (111%), and methadone (109%). Dosage unit CPD17 seizures reported to the NSS fluctuated from 2003 through 2008; the highest number of dosage units was seized in 2003. The number of pills seized fluctuated as well, peaking in 2006. The number of milliliters of CPDs seized annually increased significantly, while the number of kilograms fluctuated over the 6-year period. (See Table 2.)
Figure 4. Estimated Number of Total Analyzed Controlled Prescription Drug Items, 2003-2007
Source: National Forensic Laboratory Information System.
Note: Since 2001, NFLIS has produced estimates for the number of drug items and
drug cases analyzed by state and local laboratories from a nationally representative
sample of laboratories.
Table 2. Controlled Prescription Drug Seizures Reported to the National Seizure System, by Measurement Provided, 2003-2008
| 2003 | 2004 | 2005 | 2006 | 2007 | 2008 | |
|---|---|---|---|---|---|---|
| Dosage units | 1,190,125 | 667,040 | 478,685 | 774,238 | 425,021 | 504,170 |
| Kilograms | 97 | 1,434 | 2,668 | 325 | 3,953 | 902 |
| Milliliters | 7,179 | 30,659 | 120,490 | 131,269 | 249,081 | 901,487 |
| Pills | 3,000 | 0 | 8,696 | 764,830 | 196,388 | 15,852 |
Source: National Seizure System.
Note: Data are presented in the format reported with regard to unit of measure.
Schedule II through IV CPDs reported to NSS during this period include barbiturates,
clonazepam, codeine, Darvocet®, Darvon®, depressants, Dilaudid® (hydromorphone),
hydrocodone (Vicodin®), lorazepam (Ativan®), meperidine (Demerol®), methadone, morphine,
oxycodone, Ritalin® (methylphenidate), stimulants, Tylenol III®, Valium® (diazepam),
Xanax® (alprazolam), and Percocet®. The category “Other Prescription Drugs” was
also reported; however, that category has been omitted from this table because it
probably included noncontrolled prescription drugs.
Abusers of opioid pain relievers divert the drugs through various methods, including prescription fraud, theft, and exploitation of the Internet; however, most diversion occurs when individuals with a prescription pass their drugs to family and friends. NSDUH data show that among individuals aged 12 or older who used prescription opioid pain relievers nonmedically in the past year, 56.5 percent reported that they acquired these drugs from a friend or relative for free. Additionally, 81 percent of those who acquired the pain relievers from a friend or relative indicated that the drugs originally were acquired from one doctor. NSDUH data also show that 18.1 percent acquired the drugs directly from one doctor, 8.9 percent bought the drugs from a friend or family member, and 5.2 percent stole them from a friend or family member. Moreover, 4.1 percent purchased the opioid pain relievers from a dealer or stranger, and only 0.5 percent reported that they purchased prescription opioid pain relievers on the Internet.
Rogue Internet pharmacies18 are a significant source for diverted CPDs, particularly Schedule III and Schedule IV drugs. Unscrupulous physicians and pharmacists working through rogue Internet pharmacies engage in "script mill" practices whereby patients obtain CPDs without a face-to-face medical evaluation. Rogue pharmacy operators often recruit doctors who believe that Schedule III and IV prescription drugs are less scrutinized than Schedule II prescription drugs and, therefore, are more willing to prescribe them to a patient. Some physicians who prescribe Schedule III and IV prescription drugs without meeting with a patient may be less willing to do so with Schedule II prescription drugs because the criminal penalties for violations involving Schedule II drugs can be four times higher than those involving Schedule III and IV drugs.19 Additionally, the requirement for a hard copy of a Schedule II prescription makes Internet diversion more difficult to accomplish. Distributors and abusers typically acquire larger quantities of Schedule III and IV prescription drugs per diversion incident than Schedule II prescription drugs. Further, legitimate patients purchasing Schedule III and IV CPDs on the Internet typically obtain larger quantities of the drugs per order, according to DEA.
|
Rogue Pharmacies Dispense Inordinate Amount of Schedule III and IV Products CPDs usually account for 11 percent of the prescription drugs dispensed at legitimate brick-and-mortar pharmacies in the United States; however, CPDs often account for as much as 95 percent of the prescription drugs dispensed at rogue Internet pharmacies investigated by DEA. In November 2008 the owner/operator of several Internet pharmacies was convicted of illegal distribution of prescription medication (primarily Schedule IV diet pills), conspiracy, and money laundering. The individual's son, who also owned an illegal Internet pharmacy, was convicted of illegal distribution of prescription medication. The defendants' convictions were based on their distribution of millions of dollars' worth of CPDs without valid prescriptions to customers located throughout the United States. Upon conviction the father was ordered to forfeit $10 million in illegal proceeds that he had obtained through the scheme. The son agreed to forfeit $1.8 million in illegal proceeds based on his conviction. The father faces a maximum of 25 years' imprisonment; his son faces a maximum of 5 years' imprisonment. In September 2008 a New York man pleaded guilty to conspiracy to distribute controlled substances. From 2004 to 2007 he had dispensed approximately 440,000 Schedule IV prescription drugs to individuals worldwide who had placed orders over the Internet with his companies. The man faces a term of imprisonment of up to 5 years, a fine of $250,000, or both. In January 2007 an Illinois doctor was sentenced to imprisonment as a result of a nationwide Internet investigation that was initiated in Dubuque, Iowa. The doctor pleaded guilty on July 14, 2006, to conspiring to dispense Schedule III and IV CPDs without a legitimate medical purpose and outside the usual course of medical practice as well as laundering proceeds of his illegal distributions. He admitted to prescribing more than 62 million Schedule III and IV dosage units illegally over the Internet. In fiscal year (FY) 2007, DEA issued Immediate Suspension Orders to 10 registered pharmacies operating in Florida. These pharmacies diverted millions of dosage units of Schedule III hydrocodone across the United States via the Internet. Nine of the pharmacies chose to surrender their registration or shut down business rather than face a hearing. The tenth pharmacy did not prevail at its hearing and lost its DEA registration. In 2006 Operation Click4Drugs targeted a DTO that used more than 300 web sites to distribute large quantities of Schedule III and IV prescription drugs and passed $25 million through six bank accounts monthly. One pharmacy filled more than 2,000 prescriptions per day. Source: Drug Enforcement Administration. |
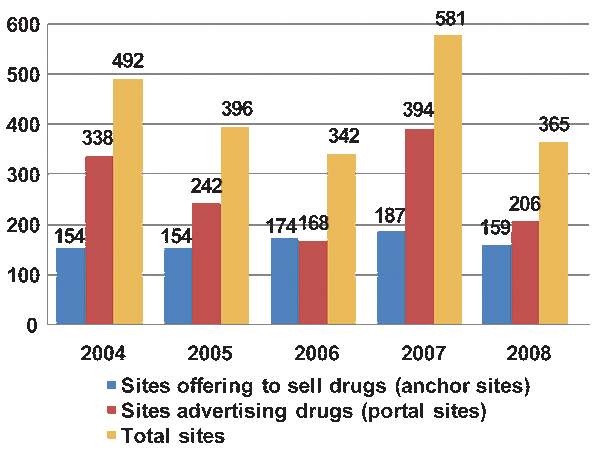
The number of Internet sites offering to sell CPDs appears to have decreased in 2008; however, the Internet may remain a significant source of supply for Schedule III and IV drugs. Federal law enforcement reporting indicates that the number of Internet sites offering to sell CPDs decreased in 2008. Federal officials cite cooperation between federal and state law enforcement agencies, Internet service providers (ISPs), package delivery services, and financial services companies typically used by rogue Internet pharmacy operators as a primary reason for the reduction in rogue pharmacies that operate on the Internet. Studies conducted by CASA confirm the law enforcement reporting. According to CASA, the number of identified rogue Internet pharmacies that advertised (portal sites) or offered to sell (anchor sites) selected Schedule II, III, or IV prescription drugs decreased 37 percent, from 581 in 2007 to 365 in 2008. (See Figure 5.) The number of Internet sites that offered CPDs20 for sale decreased from 187 in 2007 to 159 in 2008. Most of the Internet pharmacies identified in the CASA study appeared to be rogue Internet pharmacies.21 In fact, only two of the 159 anchor sites identified in 2008 were certified by the National Association of Boards of Pharmacy (NABP) as legitimate pharmacy sites. Approximately 85 percent of the sites that offered to sell CPDs did not require a physician's prescription, a percentage statistically unchanged from the 2007 study (84 percent).
Figure 5. Internet Sites Advertising or Offering to Sell Controlled Prescription Drugs, 2004-2008
Source: National Center on Addiction and Substance Abuse at Columbia University.
A relatively small number of unscrupulous physicians lose their DEA registrations for improper prescribing practices. DEA estimates that in any given year, fewer than 1 in 10,000 physicians (0.01%)22 lose their DEA registration based on a DEA investigation for improper prescribing. Unscrupulous physicians who do prescribe CPDs outside the course of professional practice, however, can divert a large quantity of drugs. Typically, CPD abusers are aware of the physicians in their areas who are willing to supply unlawful services for a cash fee. When doctors are arrested, lose their registrations, or lose their licenses, the resulting decrease in availability of CPDs on the street usually leads to increases in treatment admissions and/or the street prices of diverted CPDs, according to DEA reporting.
|
DEA's Drug Theft and Loss Database (DTL) DEA's DTL database reflects information provided by registrants under regulatory requirement to report thefts and losses of controlled substances (21 CFR §1301.74 and 1301.76). Registrants are not required to report ultimate recovery of these drugs. According to DEA, anyone attempting to draw conclusions from these data should proceed with caution because no direct correlation exists between a reported theft or loss of a controlled substance and placement of the drug into illicit channels. |
Millions of dosage units of CPDs were stolen or lost in transit from 2003 through 2007. Significant quantities of CPDs were diverted from legitimate commerce through armed robberies, customer theft, employee pilferage, transit losses, and night break-ins at pharmacies between 2003 and 2007, according to the latest data available from DEA (see Table 3). The amount of CPDs stolen or lost in transit seemingly increased from approximately 19.4 million milliliters/quantities in 2003 to nearly 28.3 million milliliters/quantities in 2007; however, of the 28.3 million milliliters/quantities reported stolen in 2007, 16 million were quickly recovered by law enforcement officials. (See text box.)
Table 3. Schedule II-V Controlled Prescription Drugs Reported Stolen or Lost in Transit Nationwide in Milliliters* and Quantities,** 2003-2007
| 2003 | 2004 | 2005 | 2006 | 2007 | |
|---|---|---|---|---|---|
| Armed Robberies | |||||
| Milliliters | 18,292 | 11,907 | 51,006 | 52,557 | 100,703 |
| Quantities | 562,642 | 394,172 | 497,014 | 576,005 | 998,623 |
| Customer Theft | |||||
| Milliliters | 12,388 | 21,801 | 10,819 | 16,514 | 12,718 |
| Quantities | 66,601 | 106,891 | 26,252 | 42,858 | 53,512 |
| Employee Pilferage | |||||
| Milliliters | 5,126,879 | 5,223,779 | 3,148,651 | 795,427 | 1,240,482 |
| Quantities | 3,756,590 | 4,627,624 | 3,413,824 | 3,137,128 | 3,274,706 |
| Lost in Transit | |||||
| Milliliters | 419,983 | 841,405 | 601,985 | 484,887 | 377,602 |
| Quantities | 1,002,207 | 1,239,354 | 1,556,462 | 2,241,642 | 18,193,469 |
| Night Break-ins | |||||
| Milliliters | 810,252 | 819,383 | 8,888,027 | 433,664 | 406,308 |
| Quantities | 7,646,336 | 4,356,118 | 6,833,214 | 6,403,356 | 3,602,619 |
| Total | |||||
| Milliliters | 6,387,794 | 6,918,275 | 12,700,488 | 1,783,049 | 2,137,813 |
| Quantities | 13,034,376 | 10,724,159 | 12,326,766 | 12,400,989 | 26,122,929 |
Source: Drug Enforcement Administration.
*
Milliliters include ampules, syringes, injectibles,
bottles, vials, lotions/ointments, liquids, and nasal spray.
**
Quantities include tablets, capsules, patches,
lollipops, powders, diskettes, and suppositories.
Note: Over 16 million of the 18 million dosage units lost in transit in one incident
in 2007 were recovered.
|
Tractor-Trailer Hauling 16 Million Dosage Units of Hydrocodone/Combination Products Stolen A tractor-trailer hauling more than 16 million dosage units of hydrocodone/combination products was stolen at a truck stop in June 2007. The tractor-trailer had been traveling from the Watson Pharmaceuticals manufacturing plant in Corona, California, to its distributor in Gurnee, Illinois, when it was stolen in Troy, Illinois. A monetary reward was offered, and an individual called with information on the tractor-trailer "almost immediately," according to police reporting. The vehicle and the hydrocodone were recovered. Source: Drug Enforcement Administration, St. Louis Field Office. |
The amount of CPDs stolen in armed robberies doubled from over 0.5 million milliliters/quantities in 2003 to nearly 1.1 million in 2007; the amount stolen by customers during that time decreased from nearly 79,000 to slightly more than 66,000 milliliters/quantities. The amount of CPDs stolen by employees of healthcare facilities and pharmacies decreased from 8.9 million milliliters/quantities in 2003 to 4.5 million in 2007. The amount lost in transit increased from more than 1.4 million milliliters/quantities in 2003 to more than 18.5 million in 2007; however, when the 16 million recovered units are subtracted from the total, the amount lost in transit is slightly more than 2.5 million (still an increase). The amount of CPDs stolen in night break-ins of pharmacies decreased substantially, from more than 8.5 million milliliters/quantities in 2003 to more than 4 million milliliters/quantities in 2007; however, the quantity of CPDs stolen in such break-ins peaked substantially in 2005 at 15.7 million milliliters/quantities. While these data indicate that significant quantities of scheduled drugs are lost or stolen annually, DEA reports that the amount of such drugs actually distributed on the illicit market is unknown because a portion of the lost and stolen drugs are quite likely recovered but not reported to DEA.
The percentage of state and local law enforcement agencies reporting high levels of prescription depressant and narcotic diversion/illicit use increased overall in the United States from 200623 through 2008, while the percentage of agencies reporting high levels of prescription stimulant diversion/illicit use decreased or was stable in most regions. The most significant increases in the percentages of law enforcement agencies reporting high levels of diversion/illicit use of pharmaceuticals were for depressants, according to the NDTS. (See Table 4.) The greatest increases occurred in the Pacific (167%), New York/New Jersey (89%), and Mid-Atlantic (83%) OCDETF Regions.24 Moreover, in 2008 more than one-half of law enforcement agencies in seven of nine OCDETF Regions reported high levels of diversion/illicit use of narcotics. The greatest increases over the 3-year period occurred in the Pacific (107%), Florida/Caribbean (72%), and West Central Regions (72%). The percentage of law enforcement agencies reporting high levels of diversion/illicit use of stimulants trended upward in only four of the nine regions and downward in three regions; in two regions there were no changes overall.
Table 4. Percentage of Law Enforcement Agencies Reporting High Levels of Diversion/Illicit Use of Pharmaceuticals, 2006*-2008
| 2006 | 2007 | 2008 | Percent of Change | |
|---|---|---|---|---|
| Narcotics | ||||
| Florida/Caribbean | 36 | 45 | 62 | 72% |
| Great Lakes | 38 | 40 | 58 | 53% |
| Mid-Atlantic | 38 | 44 | 55 | 45% |
| New England | 48 | 48 | 65 | 35% |
| New York/New Jersey | 29 | 27 | 46 | 59% |
| Pacific | 28 | 36 | 58 | 107% |
| Southeast | 48 | 49 | 63 | 31% |
| Southwest | 35 | 38 | 42 | 20% |
| West Central | 32 | 38 | 55 | 72% |
| Depressants | ||||
| Florida/Caribbean | 33 | 25 | 51 | 55% |
| Great Lakes | 23 | 26 | 39 | 70% |
| Mid-Atlantic | 23 | 27 | 42 | 83% |
| New England | 25 | 22 | 42 | 68% |
| New York/New Jersey | 18 | 11 | 34 | 89% |
| Pacific | 9 | 14 | 24 | 167% |
| Southeast | 37 | 40 | 61 | 65% |
| Southwest | 27 | 30 | 42 | 56% |
| West Central | 20 | 23 | 32 | 60% |
| Stimulants | ||||
| Florida/Caribbean | 8 | 17 | 14 | 75% |
| Great Lakes | 17 | 20 | 21 | 24% |
| Mid-Atlantic | 17 | 23 | 18 | 6% |
| New England | 17 | 19 | 23 | 35% |
| New York/New Jersey | 13 | 11 | 12 | -8% |
| Pacific | 13 | 11 | 12 | -8% |
| Southeast | 17 | 24 | 17 | 0% |
| Southwest | 18 | 17 | 9 | -50% |
| West Central | 16 | 19 | 16 | 0% |
Source: National Drug Threat Surveys.
*
NDTS survey question was changed beginning in 2006;
previous data are not comparable.
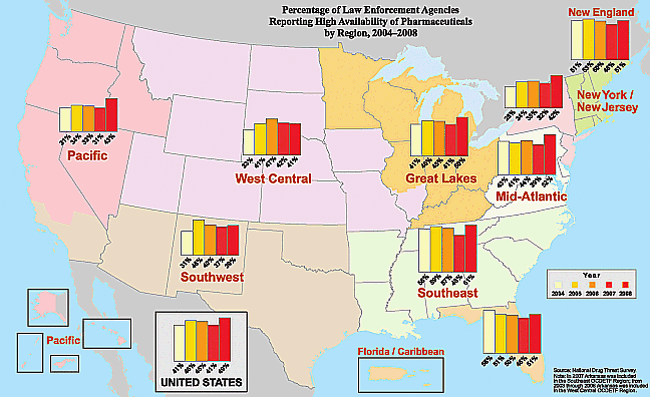
CPD diversion is prevalent throughout the United States; however, CPD diversion is highest in eastern states. Law enforcement officials in the eastern portion of the United States report the highest levels of diverted CPD availability, according to NDTS data. (See Figure 6.) The largest percentage--61 percent--of law enforcement agencies reporting high availability of pharmaceuticals in 2008 was in the Southeast OCDETF Region. Law enforcement agencies also reported high availability in the Mid-Atlantic, New England, Florida/Caribbean, and Great Lakes Regions. The percentage of law enforcement agencies in the United States reporting high availability of pharmaceuticals has trended upward in most OCDETF Regions over the past 5 years, with the exception of the Florida/Caribbean Region,25 where 5 percent fewer agencies reported high availability over that period, and in the New England Region, where availability remained relatively stable.
Figure 6. Percentage of Law Enforcement Agencies Reporting High Availability of Pharmaceuticals, by OCDETF Region, 2004-2008
Source: National Drug Threat Surveys.
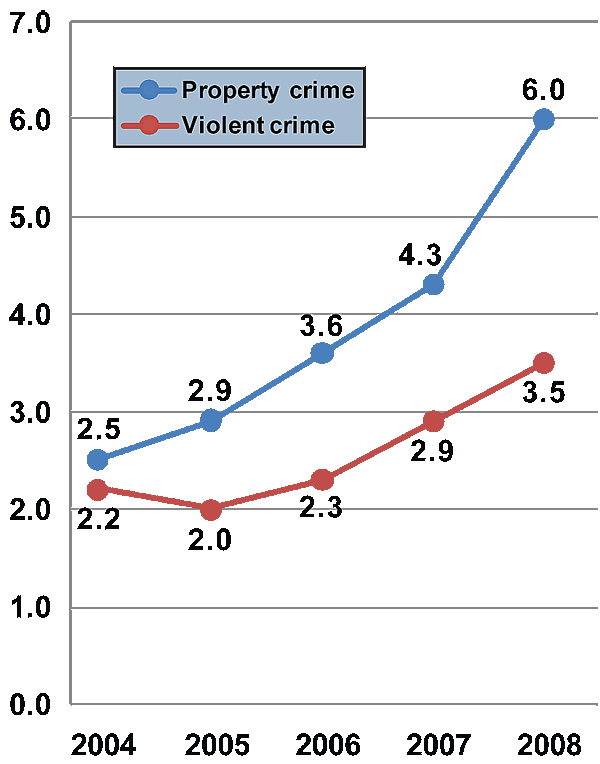
CPD diversion is associated with increases in crime. Law enforcement agencies are increasingly associating CPD diversion and abuse with violent and property crimes nationwide, particularly in regions where CPD availability is high. The percentage of law enforcement agencies reporting an association between the diversion and abuse of CPDs and property or violent crime trended upward from 2004 through 2008, according to the NDTS. (See Figure 7.) The highest percentages of law enforcement agencies reporting an association between property crime and CPD diversion and abuse were in the New England, Great Lakes, and Mid-Atlantic OCDETF Regions (15.1%, 10.0%, and 8.8%, respectively). The highest percentages of law enforcement agencies reporting an association between violent crime and CPD diversion and abuse were in the New England, Great Lakes, and Florida/Caribbean Regions (9.8%, 6.2%, and 5.5%, respectively). (Law enforcement agencies in these regions also reported high availability of diverted pharmaceuticals;26 see Figure 6.) The percentage of overall change annually was slight; however, over the 5-year period, the trend upward was 3.5 percent for property crime and 1.3 percent for violent crime.27 State and local law enforcement agencies in several areas of the United States report that some murders, retail thefts, daytime break-ins, thefts at seasonal camps, car break-ins, pharmacy burglaries, and mail and identity theft that have occurred in their jurisdictions have been linked to diversion and abuse of CPDs. Moreover, some treatment providers anecdotally report that prescription opioid abusers engage in criminal activity to obtain money when they can no longer afford to purchase the quantity of drugs that they require to achieve their intended euphoria or to prevent opioid withdrawal symptoms.
Figure 7. Percentage of Law Enforcement Agencies Reporting an Association Between Diverted Pharmaceuticals and Crime, 2004-2008
Source: National Drug Threat Surveys.
Note: Such trends are not reflected in DEA investigative and intelligence systems.
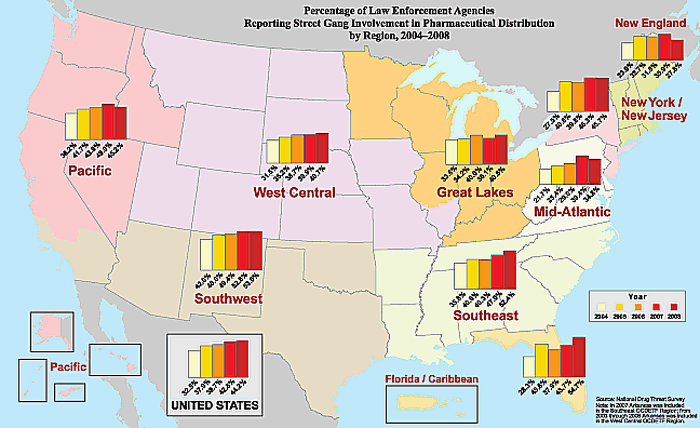
DTO involvement in CPD diversion and distribution is minimal; however, street gangs are increasingly distributing the drugs. The diversion and distribution of CPDs by DTOs and criminal groups have not been reported to any meaningful extent by law enforcement officials throughout the nation. Some law enforcement agencies and treatment providers as well as federal and private surveillance surveys have reported, however, that some CPD abusers purchase drugs from strangers and "dealers." Additionally, periodic law enforcement reporting indicates that some street dealers who sell marijuana, heroin, and cocaine have started to sell CPDs. While DTOs and criminal groups do not appear to be heavily involved in CPD distribution, law enforcement reporting does indicate that street gang and OMG involvement in CPD distribution has increased in many areas of the country. The percentage of law enforcement agencies nationwide reporting street gang involvement in illicit pharmaceutical distribution trended upward from approximately 32 percent in 2004 to 44 percent in 2008, according to the NDTS. Regionally, the percentage of law enforcement agencies reporting street gang involvement in CPD distribution during those years ranged from an average of 30 percent in the Mid-Atlantic and New England Regions to an average of 49 percent in the Southwest Region. (See Figure 8.) A few law enforcement agencies in California reported in 2008 that African American street gangs had become involved in OxyContin® distribution and that Caucasian young adults were purchasing OxyContin® from these street gang members. Moreover, one law enforcement agency in New Hampshire reported in 2008 that Bloods gang members routinely obtain OxyContin® in Massachusetts and distribute the drug in its jurisdiction, while another law enforcement agency in Texas reported in 2008 that female associates of street gangs and OMGs earn income primarily by selling diverted CPDs that they obtain through prescription fraud. Finally, a law enforcement agency in Washington State reported in 2008 that some African American street gang members were involved in the distribution of CPDs.
Figure 8. Percentage of Law Enforcement Agencies Reporting Street Gang Involvement in Pharmaceutical Distribution, by OCDETF Region, 2004-2008
Source: National Drug Threat Surveys.
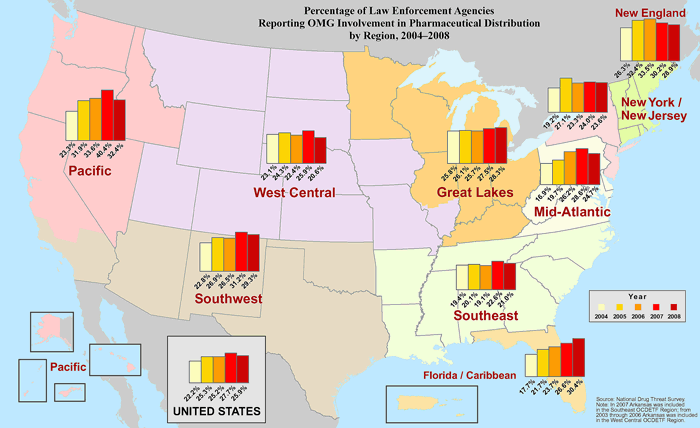
According to NDTS estimates, the percentage of law enforcement agencies nationwide reporting OMG involvement in illicit pharmaceutical distribution trended upward from approximately 22 percent in 2004 to 26 percent in 2008; however, regionally, that percentage fluctuated. (See Figure 9.) The percentage of law enforcement agencies reporting OMG involvement in CPD distribution between 2004 and 2008 ranged from an average of 20 percent in the Southeast Region to an average of 32 percent in the Pacific Region. A law enforcement agency in Virginia reported in 2008 that the War Lords Motorcycle Gang had established a local chapter, and its members reportedly were involved in trafficking Schedule II and III prescription drugs.
Figure 9. Percentage of Law Enforcement Agencies Reporting OMG Involvement in Pharmaceutical Distribution, by OCDETF Region, 2004-2008
Source: National Drug Threat Surveys.
Teenagers find diverted CPDs readily available; they can often obtain them at no cost. According to CASA's 2008 National Survey of American Attitudes on Substance Abuse XIII, for the first time in the survey's history, more teenagers reported that prescription drugs28 were easy to purchase without a prescription (19%) than reported that beer was easy to purchase (15%). Teenagers also reported that they could easily obtain CPDs from family and friends. Of the 1,002 teens participating in the 2008 CASA survey who knew a prescription drug abuser, one-third reported that the abusers could get prescription drugs from home, the medicine cabinet, or parents, while another one-third reported that abusers could acquire prescription drugs from friends or classmates.
Friends or relatives are the primary sources for CPDs among most abusers. More than half of the nonmedical users of prescription-type opioid pain relievers, tranquilizers, stimulants, and sedatives obtained the drugs they used most recently "from a friend or relative for free," according to 2006 and 2007 NSDUH data. NSDUH data further reveal that among individuals aged 12 or older who used opioid pain relievers nonmedically in the past 12 months, 55.7 percent reported in 2006 that they had obtained the opioid pain relievers from a friend or relative for free, and 56.5 percent reported the same in 2007. Another 9.3 and 8.9 percent bought the drugs from a friend or family member in 2006 and 2007, respectively. Moreover, data from a 2006 study released in the June 2008 edition of the American Journal of Public Health indicated that 22.9 percent of 700 participants in the study "loaned" their medications29 to someone else, and 26.9 percent "borrowed" someone else's prescription medication. Nearly 22 percent of study participants reported sharing prescription pain medications.
16.
The National Forensic Laboratory Information System
(NFLIS) is a program sponsored by DEA, Office of Diversion Control. NFLIS systematically
collects results from drug analyses conducted by state and local forensic laboratories.
Because of changes in reporting, NFLIS data should not be used for trending analysis.
17.
Includes seizures of CPDs from air cargo, air passengers,
buses, express mail/parcel, mail, maritime cargo, individuals on foot, trains, and
all vehicles including tractor-trailers and cargo vehicles.
18.
The Ryan Haight Online Pharmacy Consumer Protection
Act of 2008, enacted in October 2008, legally established the definition of "online
pharmacy." The Act prohibits the delivery, distribution, or dispensing of CPDs over
the Internet without a prescription written by a doctor who has conducted at least
one in-person examination of the patient. This Act is expected to have a significant
impact on CPD diversion and abuse by decreasing the number of rogue Internet pharmacies
operating on the Internet.
19.
Federal trafficking penalties for illegal Internet
distribution of Schedule II drugs are not more than 20 years imprisonment for the
first offense and a fine of $1 million for an individual and $5 million for other
than an individual. Federal trafficking penalties effective as of October 2008 for
Schedule III drugs are not more than 10 years imprisonment (up from 5 years) and
fines of not more than $500,000 (up from $250,000) for an individual and $2.5 million
(up from $1 million) for other than an individual. Penalties effective as of October
2008 for Schedule IV drugs are not more than 5 years imprisonment (up from 3 years)
and fines of not more than $250,000 for an individual and $1 million for other than
an individual.
20.
The National Center on Addiction and Substance
Abuse (CASA) at Columbia University used a list of drugs that included controlled
prescription drugs as defined by DEA in Schedules II through V but concentrated
on prescription drugs in Schedules II and III.
21.
The goal of the CASA study was to uncover as many
web sites as possible that were involved in the sale of CPDs by using Internet searches
and e-mail advertisements. CASA researchers did not complete any transactions by
purchasing the drugs because doing so would have been illegal. The methodology used
in this study can be found at http://www.casacolumbia.org/articlefiles/531-2008%20You've%20Got%20Drugs%20V.pdf
22.
Approximately 750,000 medical doctors and doctors
of osteopathic medicine were registered with DEA in 2006.
23.
Survey data prior to 2006 are not comparable because
of changes in the format of the question.
24.
For the purposes of this report, regional discussions
will be delineated along boundaries established under the Organized Crime Drug Enforcement
Task Force (OCDETF) program. The OCDETF program was established in 1982 to mount
a comprehensive attack against organized drug traffickers. The OCDETF program is
the centerpiece of the United States Attorney General's drug strategy to reduce
the availability of drugs by disrupting and dismantling major DTOs and money laundering
organizations and related criminal enterprises. The program operates nationwide
and combines the resources and unique expertise of numerous federal agencies in
a coordinated attack against major drug trafficking and money laundering organizations.
See Figure 6 for regional demarcations.
25.
Federal law enforcement reporting indicates that
numerous investigations from 2006 through 2008 targeting diversion using the Internet
have significantly decreased the number of rogue Internet pharmacies operating in
Florida. The success of these initiatives is believed to have had a considerable
impact on the availability of CPDs in the state.
26.
The NDTS uses the term "diverted pharmaceuticals"
with the understanding that law enforcement agencies responding to the survey would
report diverted pharmaceutical activity related only to distribution of scheduled
prescription drugs prosecutable under the Federal Controlled Substances Act.
27.
NDTS data regarding the association between violent
and property crime and illicit drugs are shown in
Figures 23 and
24 in Appendix A, respectively.
28.
The specific drugs mentioned in the survey question
were OxyContin®, Percocet®, Vicodin®, and Ritalin®.
29.
Specific medication categories listed in the survey
were allergy, pain, mood, antibiotic, acne, birth control, and "other."
End of page.