To
Contents
To Previous Page
To Appendix B
To Publications Page
To Home Page
To
Contents
To Previous Page
To Appendix B
To Publications Page
To Home Page

National Drug Intelligence Center |
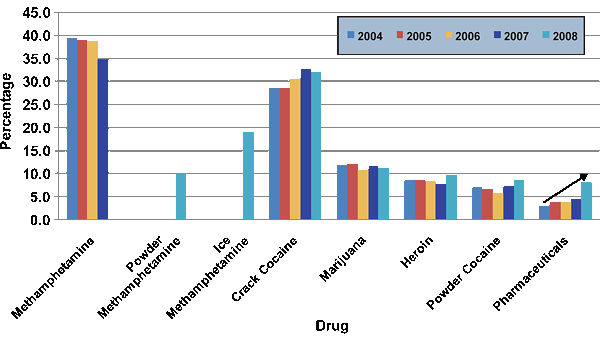
NDTS data from 2004 through 2008 indicate that diverted CPDs pose much less of a drug threat nationwide than the threat posed by illicit drugs such as cocaine, crack cocaine, heroin, marijuana, or powder or ice methamphetamine. Methamphetamine was reported as the greatest drug threat nationwide by the highest percentages of law enforcement agencies during the 5-year period, followed by crack cocaine. However, the threat posed by pharmaceuticals trended upward from 3.1 in 2004 to 8.1 percent in 2008. While this is the fastest-growing trend reported by law enforcement agencies during that time, less than 10 percent of law enforcement agencies report pharmaceuticals as their greatest drug threat. (See Figure 21.)
Figure 21. Percentage of Law Enforcement Agencies Reporting Greatest Drug Threat, by Drug, Nationwide, 2004-2008
Source: National Drug Threat Surveys.
Note: Beginning in 2008, the NDTS established powder and ice methamphetamine as
specific categories for greatest drug threat; therefore, general methamphetamine
comparisons are not made.
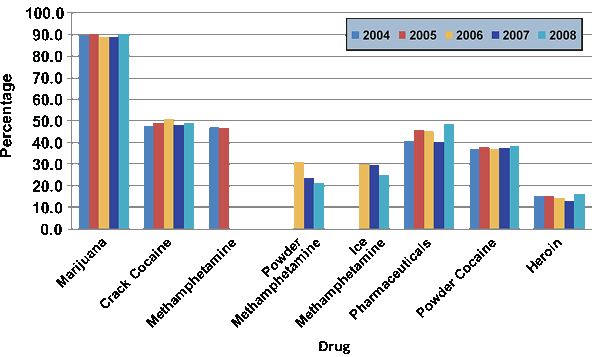
Marijuana was reported as the drug most highly available nationwide by the largest percentages of law enforcement agencies during the 5-year period, followed by crack cocaine. However, a greater percentage of law enforcement agencies nationwide reported high availability of pharmaceuticals than reported high availability of heroin or powder cocaine from 2004 through 2008. Law enforcement agency reporting indicated that high availability of pharmaceuticals nationwide trended upward over the period from 40.8 percent in 2004 to 48.7 percent in 2008. (See Figure 22.)
Figure 22. Percentage of Law Enforcement Agencies Reporting High Availability, by Drug, Nationwide, 2004-2008
Source: National Drug Threat Surveys.
Note: Beginning in 2006, the NDTS established powder and ice methamphetamine as
specific categories for high availability; therefore, general methamphetamine comparisons
are not made.
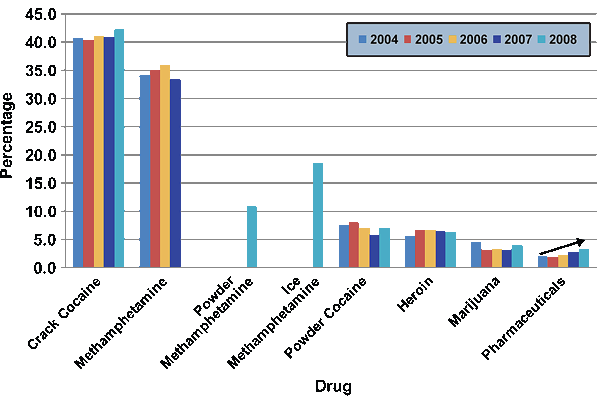
Crack cocaine and methamphetamine were reported by the greatest percentages of law enforcement agencies as being associated with violent crime nationwide from 2004 through 2008. The smallest percentages of law enforcement agencies nationwide reported an association between pharmaceuticals and violent crime. The largest upward trend was for crack cocaine, which went from 40.7 percent in 2004 to 42.3 percent in 2008, followed by pharmaceuticals, which went from 2.2 percent to 3.5 percent during that time. (See Figure 23.)
Figure 23. Percentage of Law Enforcement Agencies Reporting Association Between Drug Type and Violent Crime, Nationwide, 2004-2008
Source: National Drug Threat Surveys.
Note: Beginning in 2008, the NDTS established powder and ice methamphetamine as
specific categories for association between drugs and violent crime; therefore,
general methamphetamine comparisons are not made.
Note: Such trends are not reflected in DEA investigative and intelligence systems.
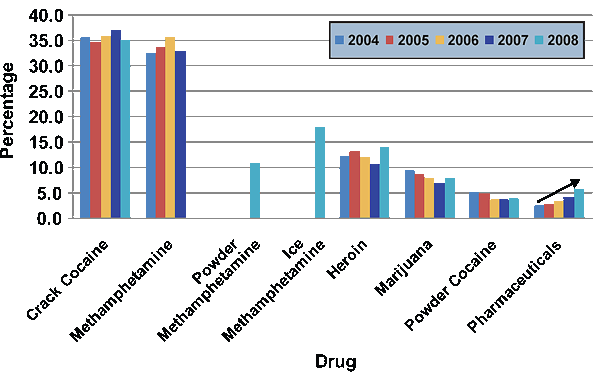
Crack cocaine and methamphetamine were reported by the greatest percentages of law enforcement agencies as being associated with property crime nationwide during the 5-year period. However, the percentages of law enforcement agencies reporting an association between drugs and property crime trended downward overall for crack cocaine; the percentages for marijuana and powder cocaine also trended downward. The largest upward trend was for pharmaceuticals, which went from 2.5 percent in 2004 to 6.0 percent in 2008. (See Figure 24.)
Figure 24. Percentage of Law Enforcement Agencies Reporting Association Between Drug Type and Property Crime, Nationwide, 2004-2008
Source: National Drug Threat Surveys.
Note: Beginning in 2008, the NDTS established powder and ice methamphetamine as
specific categories for association between drugs and property crime; therefore,
general methamphetamine comparisons are not made.
Note: Such trends are not reflected in DEA investigative and intelligence systems.
44.
Respondents to the NDTS are too numerous (more
than 3,000) to include in the source list at the end of this assessment.
45.
The relative threat posed by a specific drug requires
a subjective analytic assessment based on many considerations, such as the cost
of interdiction, seizure, and eradication; the number of individuals using or addicted
to the drug; the level of availability in U.S. drug markets; the extent and organization
of distribution groups; the level of violence associated with distribution and use
of the drug; the level of property crime associated with use of the drug; and the
level of involvement by international drug trafficking organizations (DTOs) and
gangs.
End of page.