2020 Hate Crime Statistics
FBI Releases 2020 Hate Crime Statistics
The FBI's Uniform Crime Reporting (UCR) Program serves as the national repository for crime data voluntarily collected and submitted by law enforcement. Its primary objective is to generate reliable information for use in law enforcement administration, operation, and management. The 2020 hate crimes data, submitted by 15,138 law enforcement agencies, provide information about the offenses, victims, offenders, and locations of hate crimes. Of these agencies who submitted incident reports, there were 8,263 hate crime incidents involving 11,129 offenses.
Below are some highlights from the data.
Victims of Hate Crime Incidents
|
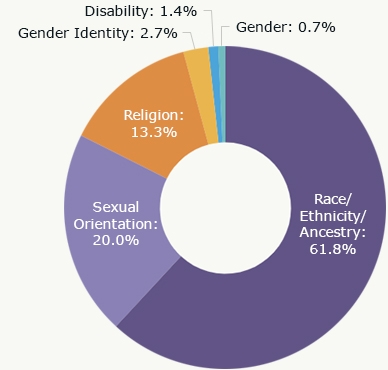
Bias Motivation Categories for Victims of Single-bias Incidents in 2020 |
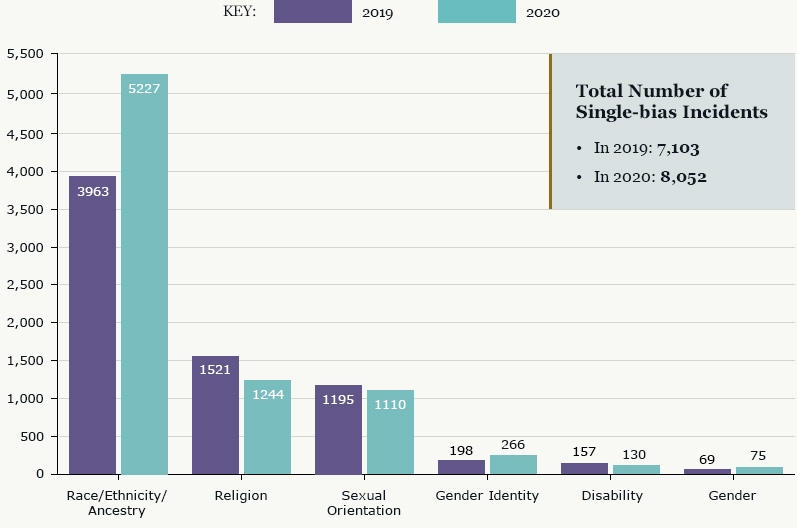
Single-bias Incident Bias Motivations by Category in 2020
| Offenses by Crime Category | Known Offenders | Location Type |
|---|---|---|
|
Among the 11,129 hate crime offenses reported:
|
Of the 6,780 known offenders:
Other races accounted for the remaining known offenders. Of the 6,169 known offenders for whom ethnicity was reported:
Of the 6,264 known offenders for whom ages were known:
|
Law enforcement agencies may specify the location of an offense within a hate crime incident as 1 of 46 location designations.
The remaining 24.8% of hate crime incidents took place at other or multiple locations.
|
Description of images on this page
Bias Motivation Categories for Victims of Single-bias Incidents in 2020: This is a pie chart showing the percentage of bias motivation categories for victims of single-bias incidents in 2020. They are as follows:
| Race/Ethnicity/Ancestry | 61.8% |
| Religion | 13.3% |
| Sexual Orientation | 20.0% |
| Gender Identity | 2.7% |
| Disability | 1.4% |
| Gender | 0.7% |
Single-bias Incident Bias Motivations by Category: This is a bar chart comparing the 2019 and 2020 data for bias motivation categories for single bias incidents. They are as follows:
| Bias Motivation Categories | 2019 | 2020 |
|---|---|---|
| Race/Ethnicity/Ancestry | 3,963 | 5,227 |
| Religion | 1,521 | 1,244 |
| Sexual Orientation | 1,195 | 1,110 |
| Gender Identity | 198 | 266 |
| Disability | 157 | 130 |
| Gender | 69 | 75 |
| Total | 7,103 | 8,052 |


