LIMITED OFFICIAL USE-LAW ENFORCEMENT
SENSITIVE//FOR OFFICIAL USE ONLY
ARCHIVED  To
Contents
To Dissemination
To Publications
Page
To Home Page
To
Contents
To Dissemination
To Publications
Page
To Home Page
Detailed Data Findings
Methamphetamine
YTD2010
- (LES//FOUO) In YTD2010, methamphetamine seizure totals along the Southwest
Border (945 kg) were 94 percent above the 2004-2010 YTD average for March (486
kg).
In fact, the amount of methamphetamine seized was above average in all areas
except the Del Rio (78% below average), Marfa (60% below average), and Tucson
(39% below average) Areas. (See Figure 1.)
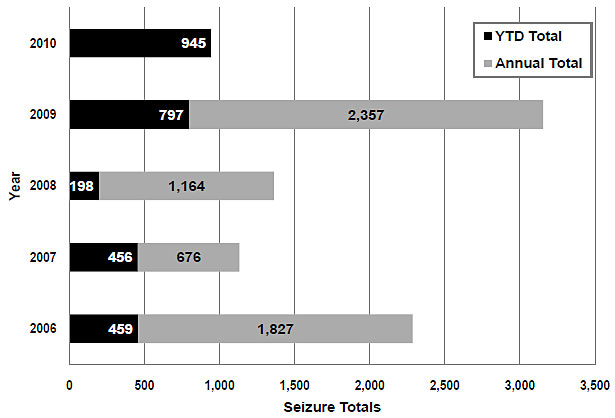
- (LES//FOUO) Methamphetamine seizure amounts in YTD2010 surpassed all other
YTD totals since 2006--specifically, YTD2009 (797 kg), YTD2008 (198 kg), YTD2007
(456 kg), and YTD2006 (459 kg). (See
Chart 1 and
Table A.)
Chart 1. (LES//FOUO)
Methamphetamine Seizure Totals, Year-to-Date and Annual, in Kilograms, 2006-2010
- (LES//FOUO) The amount of methamphetamine seized in the San Diego Area (517
kg) accounted for more than half of the total amount of the drug seized along
the Southwest Border in YTD2010 and was 30 percent higher than the YTD2009 total
for that area (398 kg). (See Table
B.)
- (LES//FOUO) Seventy-four percent of the total amount of methamphetamine
seized at ports of entry (POEs) in YTD2010 (580 kg) was seized at California
POEs (323 kg). Officers at the San Ysidro (234 kg), Otay Mesa (182 kg), and
Calexico (92 kg) POEs seized the most methamphetamine in YTD2010. (See
Table B.)
- (LES//FOUO) Methamphetamine seizure amounts in sectors decreased 12 percent
in YTD2010 (166 kg) compared with YTD2009 (189 kg). The Yuma Sector (63 kg)
was the primary sector for methamphetamine seizure amounts in YTD2010, accounting
for more than one-third of the total amount seized. The amount seized in that
sector in YTD2010 was considerably higher than all annual totals since 2006--specifically,
2009 (13 kg), 2008 (3 kg), 2007 (12 kg), and 2006 (1 kg). (See
Table B.)
March 2010
- (LES//FOUO) Methamphetamine seizure totals along the Southwest Border in
March 2010 (364 kg) were 103 percent above the March 2004-2010 average (179
kg). Methamphetamine seizures were above average in all areas except the Marfa
(73% below average), Tucson (67% below average), and El Paso (64% below average)
Areas. (See Figure 2.)
- (LES//FOUO) The amount of methamphetamine seized in March 2010 was 86 percent
higher than the amount seized in March 2009 (195 kg) and was the third-highest
monthly seizure amount since 2006, behind only May 2009 (393 kg) and February
2010 (369 kg). Most methamphetamine seized this month was seized in the San
Diego Area (235 kg, or 64% of the total). (See
Table A.)
- (LES//FOUO) Methamphetamine seizure amounts at POEs increased 91 percent
in March 2010 (330 kg) compared with March 2009 (172 kg), while the amount seized
in sectors increased 49 percent from March 2009 (23 kg) to March 2010 (34 kg).
- (LES//FOUO) Seventy-nine percent of the methamphetamine seized at POEs in
March 2010 was seized at California POEs (257 kg). Officers at the Otay Mesa
POE (92 kg) and San Ysidro POE (82 kg) seized the most methamphetamine at POEs
this month.
- (LES//FOUO) The Yuma Sector was the primary sector for methamphetamine seizures
in March 2010 (15 kg), accounting for 43 percent of the methamphetamine seized
between POEs. Monthly seizure amounts in this sector in 2010 were the third-highest
since 2006, surpassed only by the amounts seized in January 2010 (30 kg) and
February 2010 (19 kg).
To Top
To Contents
Heroin
YTD2010
- (LES//FOUO) Heroin seizure totals in YTD2010 (196 kg) were 95 percent above
the 2004-2010 YTD average for March (101 kg). Seizure totals were above average
in all areas except the Yuma (100% below average) and Del Rio (45% below average)
Areas. (See Figure 1.)
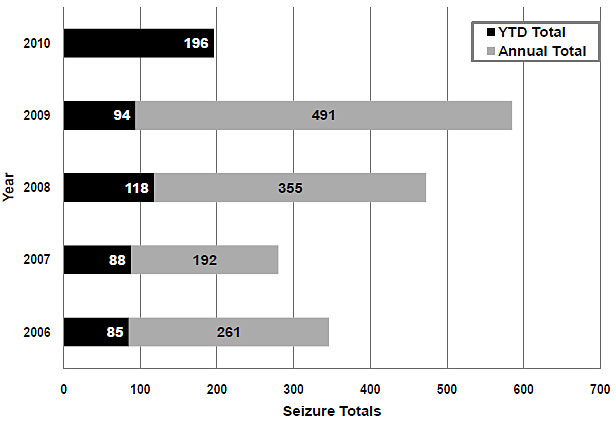
- (LES//FOUO) The amount of heroin seized in YTD2010 exceeded all other YTD
totals since 2006--specifically, YTD2009 (94 kg), YTD2008 (118 kg), YTD2007
(88 kg), and YTD2006 (85 kg). (See
Chart 2 and Table A.)
Chart 2. (LES//FOUO)
Heroin Seizure Totals, Year-to-Date and Annual, in Kilograms, 2006-2010
- (LES//FOUO) More heroin was seized in the San Diego Area (72 kg, or 37%
of the total) than in any other area in YTD2010. The amount of heroin seized
in the Tucson Area in YTD2010 (61 kg, or 31% of the total) increased 128 percent
from the amount seized in YTD2009 (27 kg). (See
Table B.)
- (LES//FOUO) Heroin seizure totals at POEs increased 113 percent in YTD2010
(179 kg) compared with YTD2009 (84 kg). Most heroin was seized at the San Ysidro
(48 kg), Nogales (32 kg), Lukeville (29 kg), and Calexico East (23 kg) POEs,
accounting for 74 percent of the total amount of the drug seized at POEs in
YTD2010. (See Table B.)
- (LES//FOUO) Heroin amounts seized in sectors in YTD2010 (17 kg) increased
68 percent compared with amounts seized in YTD2009 (10 kg). The San Diego Sector
was the primary sector for heroin seizures in YTD2010 (8 kg), accounting for
50 percent of the total amount seized. (See
Table B.)
March 2010
- (LES//FOUO) Heroin seizure amounts along the Southwest Border in March 2010
(55 kg) were 61 percent above the March 2004-2010 average (34 kg), yet were
below average in all areas except for the El Paso (473% above average), Marfa
(204% above average), and Tucson (180% above average) Areas. (See
Figure 2.)
- (LES//FOUO) The amount of heroin seized in March 2010 surpassed March totals
in 2009 (28 kg), 2008 (33 kg), 2007 (28 kg), and 2006 (34 kg). (See
Table A.)
- (LES//FOUO) The amount of heroin seized in the Tucson Area (44 kg, or 80%
of total) was the highest monthly seizure total recorded in that area since
2006. This amount was also the fifth-highest monthly total among Southwest Border
areas since 2006, surpassed only by the amounts seized in the El Centro Area
in August 2008 (47 kg) and the San Diego Area in October 2008 (50 kg), May 2009
(45 kg), and February 2010 (59 kg).
- (LES//FOUO) Most of the heroin seized at POEs this month was seized at the
Lukeville (29 kg) and Nogales (15 kg) POEs. Heroin seizures at the Lukeville
POE have been recorded only two other times since 2006--in January 2009 (15
kg) and February 2009 (8 kg).
- (LES//FOUO) The amount of heroin seized in sectors decreased 61 percent
in March 2010 (4 kg) compared with March 2009 (10 kg). Agents reported seizures
in only two sectors this month--Marfa (3 kg) and San Diego (1 kg). Heroin has
been seized in the Marfa Sector in only three other months since 2006--February
2007 (1 kg), December 2007 (less than 1 kg), and February 2010 (less than 1
kg).
To Top
To Contents
Cocaine
YTD2010
- (LES//FOUO) Cocaine seizure totals in YTD2010 (3,231 kg) were 22 percent
below the 2004-2010 YTD average for March (4,154 kg). Seizure totals were below
average in all areas except the Yuma (114% above average), San Diego (57% above
average), and El Centro (9% above average) Areas. (See
Figure 1.)
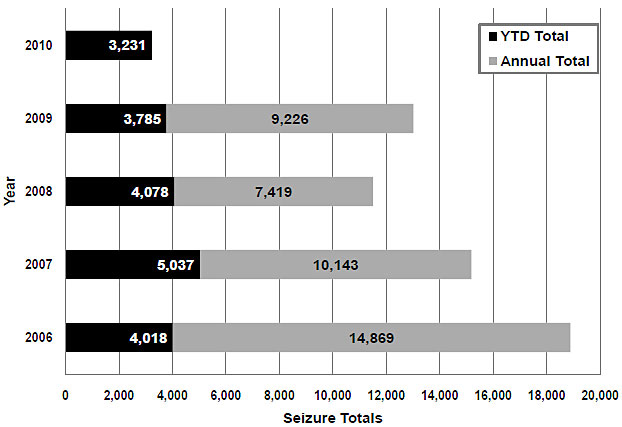
- (LES//FOUO) The amount of cocaine seized in YTD2010 (3,231 kg) was the lowest
YTD total since 2006--specifically, YTD2009 (3,785 kg), YTD2008 (4,078 kg),
YTD2007 (5,037 kg), and YTD2006 (4,018 kg). (See
Chart 3 and
Table B.)
Chart 3. (LES//FOUO)
Cocaine Seizure Totals, Year-to-Date and Annual, in Kilograms, 2006-2010
- (LES//FOUO) In YTD2010, the greatest amounts of cocaine were seized in the
Rio Grande Valley
(861 kg, or 27% of the total) and El Centro (738 kg, or 23% of the total) Areas.
Additionally, the amount of cocaine seized in the Yuma Area (244 kg) surpassed
all other YTD totals for that area--specifically, YTD2009 (182 kg), YTD2008
(78 kg), YTD2007 (93 kg), and YTD2006 (149 kg). (See Table B.)
- (LES//FOUO) The amount of cocaine seized at POEs in YTD2010 (1,813 kg) decreased
30 percent compared with the amount seized in YTD2009 (2,584 kg). The Calexico
(484 kg), Laredo (267 kg), and Nogales (237 kg) POEs were the primary POEs for
cocaine seizures in YTD2010, accounting for 54 percent of the total amount of
drug seized. (See Table B.)
- (LES//FOUO) Cocaine seizure amounts in sectors increased 18 percent in YTD2010
(1,418 kg) compared with YTD2009 (1,201 kg). The Rio Grande Valley (653 kg),
Laredo (276 kg), and San Diego (166 kg) Sectors accounted for 77 percent of
the total amount of cocaine seized in YTD2010. Furthermore, the amount of cocaine
seized in the Yuma Sector (118 kg) surpassed all other YTD totals since 2006--specifically,
YTD2009 (15 kg), YTD2008 (less than 1 kg), YTD2007 (less than 1 kg), and YTD2006
(less than 1 kg). (See Table B.)
March 2010
- (LES//FOUO) Cocaine seizure amounts along the Southwest Border in March
2010 (1,188 kg) were 17 percent below the March 2004-2010 average (1,429 kg).
Cocaine seizure totals were below average in all areas except the Yuma (138%
above average), San Diego (102% above average), and El Centro (67% above average)
Areas. (See Figure 2.)
- (LES//FOUO) The amount of cocaine seized in March 2010 (1,188 kg) decreased
13 percent compared with March 2009 (1,371 kg). (See
Table A.)
- (LES//FOUO) The El Centro and Rio Grande Valley Areas were the primary areas
for seizures in March 2010. The amount of cocaine seized in the El Centro Area
(419 kg) increased slightly compared with the March 2009 total (403 kg), while
the amount seized in the Rio Grande Valley Area (269 kg) decreased 40 percent
compared with the March 2009 total (451 kg). Although the Yuma Area continued
to record large monthly seizure amounts, the March 2010 total (70 kg) was 15
percent lower than the amount seized in March 2009 (83 kg).
- (LES//FOUO) Cocaine seizure amounts at POEs increased slightly in March
2010 (829 kg) compared with March 2009 (805 kg). Most of the cocaine seized
this month was seized at the Calexico (287 kg, or 35% of total) and Laredo (100
kg, or 12% of total) POEs. Furthermore, the amount of cocaine seized at the
San Ysidro POE in March 2010 (81 kg) was the highest monthly seizure total since
January 2007 (84 kg).
- (LES//FOUO) Cocaine seizures between POEs decreased 37 percent in March
2010 (360 kg) compared with March 2009 (566 kg). The Rio Grande Valley (181
kg) and El Centro (74 kg) Sectors accounted for 71 percent of the total amount
of cocaine seized in March 2010. Additionally, the amount of cocaine seized
in the San Diego Sector (34 kg) decreased significantly compared with March
2009 total (142 kg). This was the lowest monthly seizure total in the San Diego
Sector since December 2009 (29 kg).
To Top
To Contents
Marijuana
YTD2010
- (LES//FOUO) The amount of marijuana seized along the Southwest Border in
YTD2010 (371,854 kg) was 29 percent above the 2004-2010 YTD average for March
(288,559 kg). Marijuana seizure totals were above average in all areas except
the El Centro (66% below average), El Paso (44% below average), San Diego (19%
below average), and Yuma (13% below average) Areas. (See
Figure 1.)
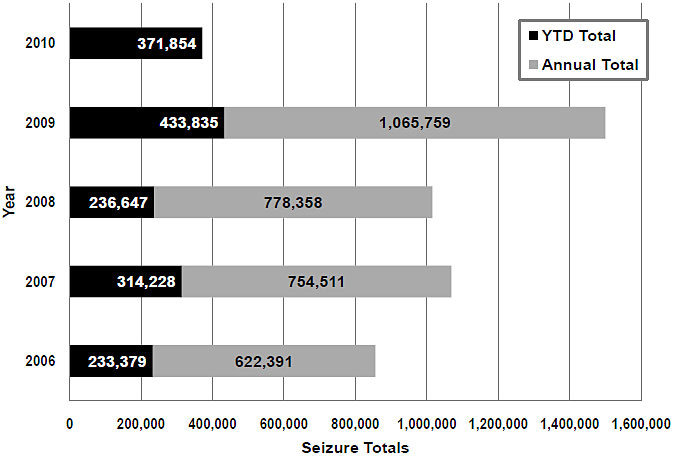
- (LES//FOUO) Marijuana seizure totals in YTD2010 were 14 percent lower than
in YTD2009 (433,835 kg) but were significantly higher than the amounts seized
in YTD2008 (236,647 kg), YTD2007 (314,228 kg), and YTD2006 (233,379 kg). (See
Chart 4 and
Table A.)
Chart 4. (LES//FOUO)
Marijuana Seizure Totals, Year-to-Date and Annual, in Kilograms, 2006-2010
- (LES//FOUO) Most marijuana was seized in the Tucson (143,041 kg, or 38%
of total) and Rio Grande Valley (112,926 kg, or 30% of total) Areas in YTD2010.
Marijuana seizure amounts in the Marfa Area increased 117 percent in YTD2010
(7,403 kg) compared with YTD2009 (3,418 kg), while seizure amounts in the El
Centro Area decreased 80 percent in YTD2010 (4,405 kg) compared with YTD2009
(22,539 kg). Seizure amounts in the El Centro Area in YTD2010 were also substantially
lower than in YTD2008 (11,597 kg), YTD2007 (24,100 kg), and YTD2006 (13,580
kg). (See Table B.)
- (LES//FOUO) The amount of marijuana seized between POEs decreased 14 percent
in YTD2010 (301,817 kg) compared with YTD2009 (350,292 kg). Marijuana was seized
primarily by agents in the Tucson (131,655 kg, or 44% of total) and Rio Grande
Valley (110,441 kg, or 37% of total) Sectors. The amount of the drug seized
in the Tucson Sector decreased 20 percent from YTD2009 (164,840 kg) to YTD2010,
while the amount seized in the Rio Grande Valley Sector decreased 6 percent
during the same period. (See Table
B.)
- (LES//FOUO) Marijuana seizure totals at POEs decreased 16 percent in YTD2010
(70,037 kg) compared with YTD2009 (83,543 kg). The Laredo POE (22,508 kg) was
the primary POE for marijuana seizures in YTD2010, accounting for 32 percent
of the total amount seized at POEs. Seizure amounts at the POE increased substantially,
surpassing all other YTD totals since 2006--specifically, 2009 (5,174 kg), 2008
(812 kg), 2007 (1,711 kg), and 2006 (3,478 kg). Seizures at the El Paso POE
(6,991 kg), the primary POE for marijuana seizures since 2006, were the lowest
since 2006--specifically, 2009 (18,303 kg), 2008 (19,565 kg), 2007 (24,703 kg),
and 2006 (11,381 kg). (See Table B.)
- (LES//FOUO) The amount of marijuana seized at the Eagle Pass POE in YTD2010
(4,601 kg) surpassed all annual totals at that POE since 2006--specifically,
2009 (1,303 kg), 2008 (2,130 kg), 2007 (1,064 kg), and 2006 (1,634 kg).
March 2010
- (LES//FOUO) The amount of marijuana seized along the Southwest Border in
March 2010 (125,303 kg) was 21 percent above the March 2004-2010 average (103,424
kg). Marijuana seizure amounts were above average in all areas except the El
Centro (64% below average), El Paso (47% below average), San Diego (28% below
average), and Yuma (41% below average) Areas. (See
Figure 2.)
- (LES//FOUO) Total marijuana seizures decreased 22 percent in March 2010
compared with March 2009 (161,542 kg). (See
Table A.)
- (LES//FOUO) Most marijuana was seized in the Tucson (50,638 kg, or 40% of
total) and Rio Grande Valley (28,365 kg, or 23% of total) Areas in March 2010.
Decreases in seizure amounts occurred in all areas except the Marfa (165% increase),
Del Rio (106% increase), and Laredo (68% increase) Areas.
- (LES//FOUO) The amount of marijuana seized in the Del Rio Area in March
2010 (6,643 kg) was the second-highest monthly seizure amount since 2006, surpassed
only by the amount seized in November 2009 (7,077 kg). This increase can be
attributed primarily to a large seizure total at the Eagle Pass POE in March
2010 (3,380 kg); this amount was the highest monthly seizure amount at that
POE since 2006.
- (LES//FOUO) The amount of marijuana seized in sectors decreased 27 percent
in March 2010 (92,508 kg) compared with March 2009 (127,592 kg). Seizure amounts
in the Tucson (45,524 kg) and Rio Grande Valley (27,507 kg) Sectors accounted
for 79 percent of the total amount seized between POEs this month. The amount
of marijuana seized in the Rio Grande Valley Sector in March 2010 was the lowest
monthly seizure amount since September 2009 (19,309 kg).
- (LES//FOUO) The Laredo POE (12,481 kg) was the primary POE for marijuana
seizures in March 2010, accounting for 38 percent of the marijuana seized at
POEs along the Southwest Border. The amount of marijuana seized at the POE was
the largest monthly amount seized there since 2006 and was more than double
the amount seized in May 2009 (6,031 kg), the second-highest seizure month since
2006. This was also the fourth consecutive month in which seizures totaled more
than 4,000 kilograms at the Laredo POE, the others being December 2009 (4,892
kg), January 2010 (5,773 kg), and February 2010 (4,254 kg). Monthly seizure
amounts at the POE exceeded 4,000 kilograms in only one other month--October
2008 (4,056 kg)--since 2006.
To Top
To Contents
Table A. (LES//FOUO) Illicit
Drug Seizures Along the U.S. Southwest Border, in Kilograms
Drug
(For Month) |
March
2006 |
March
2007 |
Percent of Change March
2006 to March
2007 |
March
2008 |
Percent of Change March
2007 to March
2008 |
March
2009 |
Percent of Change March
2008 to March
2009 |
March
2010 |
Percent of Change March
2009 to March
2010 |
| 88,081 |
113,135 |
28 |
83,883 |
-26 |
161,542 |
93 |
125,303 |
-22 |
| 1,173 |
1,821 |
55 |
1,724 |
-5 |
1,371 |
-20 |
1,188 |
-13 |
| 202 |
181 |
-10 |
64 |
-65 |
195 |
205 |
364 |
86 |
| 34 |
28 |
-18 |
33 |
18 |
28 |
-16 |
55 |
99 |
| 89,490 |
115,165 |
29 |
85,704 |
-26 |
163,136 |
90 |
126,910 |
-22 |
Drug
(Year-to-Date) |
Year-to-Date 2006 |
Year-to-Date 2007 |
Percent of Change Year-to-Date 2006 to Year-to-Date
2007 |
Year-to-Date 2008 |
Percent of Change Year-to-Date 2007 to Year-to-Date
2008 |
Year-to-Date 2009 |
Percent of Change Year-to-Date 2008 to Year-to-Date
2009 |
Year-to-Date 2010 |
Percent of Change Year-to-Date 2009 to Year-to-Date
2010 |
| 233,379 |
314,228 |
35 |
236,647 |
-25 |
433,835 |
83 |
371,854 |
-14 |
| 4,018 |
5,037 |
25 |
4,078 |
-19 |
3,785 |
-7 |
3,231 |
-15 |
| 459 |
456 |
0 |
198 |
-57 |
797 |
303 |
945 |
18 |
| 85 |
88 |
3 |
118 |
34 |
94 |
-20 |
196 |
108 |
| 237,940 |
319,809 |
34 |
241,041 |
-25 |
438,512 |
82 |
376,226 |
-14 |
Source: U.S. Customs and Border Protection.
Note: Figures have been rounded and thus may not equal the totals and percentage
changes shown.
To Top
To Contents
Table B. (LES//FOUO) Primary Areas,
POEs, and Sectors for Drug Seizure Amounts in 2009 and YTD2010, in Kilograms
| |
Marijuana |
Cocaine |
Methamphetamine |
Heroin |
| 2009 |
YTD2010 |
2009 |
YTD2010 |
2009 |
YTD2010 |
2009 |
YTD2010 |
| Tucson |
607,338 |
Tucson |
143,041 |
Rio Grande Valley |
3,849 |
Rio Grande Valley |
861 |
San Diego |
1,650 |
San Diego |
517 |
San Diego |
235 |
San Diego |
72 |
| Rio Grande Valley |
446,129 |
Rio Grande Valley |
112,926 |
El Centro |
3,265 |
El Centro |
738 |
El Centro |
515 |
El Centro |
111 |
Tucson |
93 |
Tucson |
61 |
| Laredo |
128,984 |
Laredo |
45,760 |
San Diego |
1,610 |
Laredo |
542 |
Rio Grande Valley |
348 |
Rio Grande Valley |
93 |
Rio Grande Valley |
89 |
El Centro |
26 |
| El Paso |
54,848 |
Laredo |
22,508 |
Calexico |
2,357 |
Calexico |
484 |
San Ysidro |
855 |
San Ysidro |
234 |
Otay Mesa |
128 |
San Ysidro |
48 |
| San Ysidro |
32,233 |
San Ysidro |
8,950 |
Hidalgo |
1,247 |
Laredo |
267 |
Otay Mesa |
582 |
Otay Mesa |
182 |
San Ysidro |
90 |
Nogales |
32 |
| Otay Mesa |
31,262 |
El Paso |
6,991 |
Nogales |
934 |
Nogales |
237 |
Calexico |
307 |
Calexico |
92 |
Nogales |
65 |
Lukeville |
29 |
| Tucson |
563,177 |
Tucson |
131,655 |
Rio Grande Valley |
1,921 |
Rio Grande Valley |
653 |
San Diego |
190 |
Yuma |
63 |
Rio Grande Valley |
52 |
San Diego |
8 |
| Rio Grande Valley |
430,229 |
Rio Grande Valley |
110,441 |
San Diego |
872 |
Laredo |
276 |
Rio Grande Valley |
168 |
Laredo |
43 |
El Centro |
39 |
Rio Grande Valley |
4 |
| Laredo |
101,240 |
Laredo |
23,252 |
Laredo |
822 |
San Diego |
166 |
Laredo |
48 |
San Diego |
41 |
San Diego |
17 |
Marfa |
3 |
Source: U.S. Customs and Border Protection.
Note: The areas, POEs, and sectors in red changed rank in YTD2010 compared with
2009.
Footnotes
.
(U) Seizure totals are rounded and thus may not reflect the percentage changes shown.
.
(U) An area includes one sector but may include more than one Office of Field Operations
(OFO) of a CBP office and multiple POEs. Areas are depicted on the maps in
Appendix A using sector boundaries
and titles; however, the totals include both OFO POE and Office of Border Patrol
(OBP) sector seizure amounts. Sectors consist of areas between POEs.
.
(U) Beginning with this month's report, the McAllen Area and McAllen Sector will
be referred to as the Rio Grande Valley Area and Rio Grande Valley Sector, respectively,
due to a name change by CBP.
To Top
To Contents
To Dissemination
To Publications
Page
To Home Page
LIMITED OFFICIAL USE-LAW ENFORCEMENT SENSITIVE//FOR OFFICIAL
USE ONLY
End of page.