LIMITED OFFICIAL USE-LAW ENFORCEMENT
SENSITIVE//FOR OFFICIAL USE ONLY
ARCHIVED  To
Contents
To Dissemination
To Publications
Page
To Home Page
To
Contents
To Dissemination
To Publications
Page
To Home Page
Detailed Data Findings
Heroin
YTD2010
- (LES//FOUO) Heroin seizure totals in YTD2010 (141 kg) were 112 percent above
the 2004-2010 average (67 kg).
Seizure totals were above average in all areas
except Yuma (100% below average), Marfa (93% below average), and Del Rio (44%
below average). (See
Drug Seizure
Status map.)
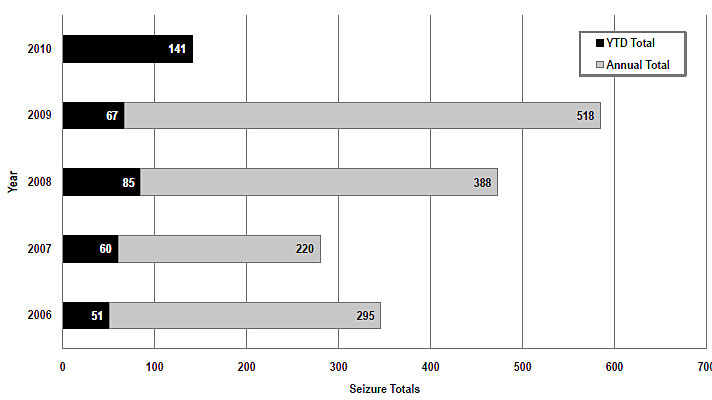
- (LES//FOUO) The amount of heroin seized in YTD2010 exceeded all other YTD
totals since 2006--specifically, YTD2009 (67 kg), YTD2008 (85 kg), YTD2007 (60
kg), and YTD2006 (51 kg). (See Chart
1 and Table A.)
Chart 1. (LES//FOUO)
Heroin Seizure Totals, Year-to-Date and Annual, in Kilograms, 2006-2010
- (LES//FOUO) More heroin was seized in the San Diego Area (69 kg, or 49%
of the total) than in any other area in YTD2010. The amount seized in the San
Diego Area in YTD2010 was 101 percent higher than the amount seized in YTD2009
(35 kg). (See Table B.)
- (LES//FOUO) Heroin seizure totals at ports of entry (POEs) increased 93
percent in YTD2010 (128 kg) compared with YTD2009 (66 kg). Most of this heroin
(69%) was seized at the San Ysidro (48 kg), Calexico East (23 kg), and Nogales
(17 kg) POEs.
- (LES//FOUO) Heroin seizure amounts in sectors increased significantly in
YTD2010
(13 kg) compared with YTD2009 (less than 1 kg). The San Diego Sector was the
primary sector for heroin seizures in YTD2010 (7 kg), accounting for 57 percent
of the total amount seized. (See Table
B.)
February 2010
- (LES//FOUO) Heroin seizure amounts along the Southwest Border in February
2010
(109 kg) were 156 percent above the 2004-2010 average (42 kg). Heroin seizures
were above average in the El Centro (600% above average), San Diego (209% above
average), Tucson (119% above average), El Paso (50% above average), and Laredo
(38% above average) Areas. (See
Drug Seizure
Status map).
- (LES//FOUO) The amount of heroin seized in February 2010 was the second-highest
monthly seizure total since 2006, surpassed only by the amount seized in October
2009 (132 kg). In fact, February 2010 seizures were higher than YTD totals for
2009 (67 kg), 2008 (85 kg), 2007 (60 kg), and 2006 (51 kg). (See
Table A.)
- (LES//FOUO) Heroin seizure amounts were highest in the San Diego (59 kg)
and El Centro (22 kg) Areas, accounting for 74 percent of the total amount of
heroin seized. The amount seized in the San Diego Area was the highest monthly
seizure total since 2006, while the amount seized in the El Centro Area was
the third-highest monthly seizure total, surpassed only by the amounts seized
in August 2008 (47 kg) and October 2009 (28 kg).
- (LES//FOUO) Heroin seizure totals at POEs in February 2010 (107 kg) exceeded
100 kilograms for the first time since 2006.
- (LES//FOUO) Most of the heroin seized at POEs this month was seized at the
San Ysidro (48 kg), Calexico East (22 kg), and Nogales (17 kg) POEs. Officers
at both the San Ysidro and Calexico East POEs recorded the highest monthly seizure
totals at those POEs since 2006.
- (LES//FOUO) The amount of heroin seized in sectors increased slightly in
February 2010 (1 kg) compared with February 2009 (less than 1 kg). Agents reported
seizures in only two sectors this month--Del Rio (1 kg) and Marfa (less than
1 kg).
To Top
To Contents
Cocaine
YTD2010
- (LES//FOUO) Cocaine seizure totals in YTD2010 (2,043 kg) were 25 percent
below the 2004-2010 average (2,725 kg). Cocaine seizure totals were below average
in all areas except the Yuma (105% above average) and San Diego (39% above average)
Areas. (See
Drug Seizure
Status map.)
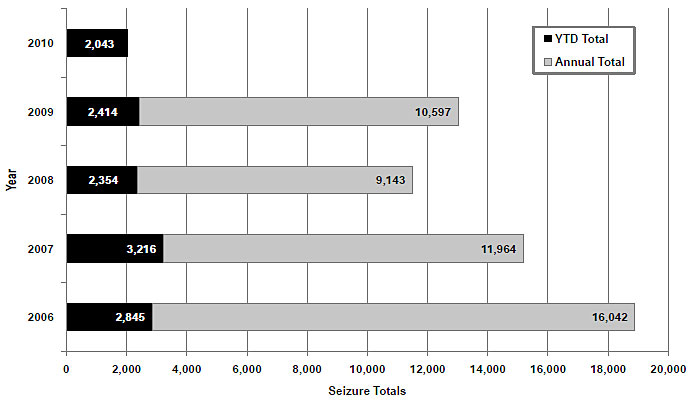
- (LES//FOUO) The amount of cocaine seized in YTD2010 was the lowest YTD total
since 2006--specifically, 2009 (2,414 kg), 2008 (2,354 kg), 2007 (3,216 kg),
and 2006 (2,845 kg). (See Chart 2
and Table A.)
Chart 2. (LES//FOUO)
Cocaine Seizure Totals, Year-to-Date and Annual, in Kilograms, 2006-2010
- (LES//FOUO) Cocaine seizure amounts in YTD2010 were highest in the McAllen
(591 kg), Laredo (431 kg), and El Centro (320 kg) Areas, accounting for 66 percent
of the total amount of cocaine seized along the Southwest Border. The amount
of cocaine seized in the Yuma Area (174 kg) was the highest YTD total since
2006--specifically, 2009 (98 kg), 2008 (49 kg), 2007 (70 kg), and 2006 (149
kg).
- (LES//FOUO) The total amount of cocaine seized at POEs in YTD2010 (985 kg)
was significantly lower than all other YTD totals since 2006--specifically,
YTD2009 (1,780 kg), YTD2008 (1,562 kg), YTD2007 (2,295 kg), and YTD2006 (2,256
kg).
- (LES//FOUO) Most cocaine seized at POEs in YTD2010 was seized at the Calexico
(197 kg), Nogales (171 kg), and Laredo (167 kg) POEs. Furthermore, the amount
of cocaine seized at the Hidalgo POE (46 kg) was the lowest YTD total since
2006--specifically, YTD2009 (236 kg), YTD2008 (91 kg), YTD2007 (624 kg), and
YTD2006 (175 kg). The amount seized at the Otay Mesa POE (111 kg) was the highest
YTD total since 2006--specifically, YTD2009 (61 kg), YTD2008 (22 kg), YTD2007
(99 kg), and YTD2006 (17 kg).
- (LES//FOUO) Cocaine seizures between POEs increased 67 percent in YTD2010
(1,059 kg) compared with YTD2009 (634 kg). The McAllen (473 kg), Laredo (264
kg), and San Diego (133 kg) Sectors accounted for 82 percent of the total amount
of cocaine seized in YTD2010. Moreover, the amount of cocaine seized in the
Yuma Sector (103 kg) greatly surpassed all other YTD totals since 2006--specifically,
YTD2009 (no seizures), YTD2008 (less than 1 kg), YTD2007 (no seizures), and
YTD2006 (less than 1 kg).
February 2010
- (LES//FOUO) Cocaine seizure amounts along the Southwest Border in February
2010 (1,265 kg) were 17 percent below the 2004-2010 average (1,526 kg). Cocaine
seizure totals were below average in all areas except the Yuma (91% above average),
San Diego (60% above average), and El Centro (13% above average) Areas. (See
Drug Seizure
Status map.)
- (LES//FOUO) The amount of cocaine seized in February 2010 was slightly higher
than the amount seized in February 2009 (1,229 kg) but lower than the amounts
seized during that month in 2008 (1,274 kg), 2007 (1,541 kg), and 2006 (1,570
kg). Cocaine seizure amounts in February 2010 were the highest since July 2009
(1,579 kg).
- (LES//FOUO) Cocaine seizure amounts in February 2010 were highest in the
McAllen (310 kg), Laredo (291 kg), and El Centro (239 kg) Areas, accounting
for 66 percent of the total amount of cocaine seized.
- (LES//FOUO) Cocaine seizures at POEs decreased 22 percent in February 2010
(638 kg) compared with February 2009 (821 kg). Most of the cocaine seized at
POEs this month was seized at the Calexico (141 kg), Nogales (113 kg), and Laredo
(103 kg) POEs. Furthermore, the amount of cocaine seized at the Hidalgo POE
(8 kg) in February 2010 was the lowest monthly seizure total at that POE since
August 2009 (6 kg), while the amount seized at the Otay Mesa POE (81 kg) was
the third-highest monthly seizure total since 2006, surpassed only by the amounts
seized in July 2009 (153 kg) and August 2007 (82 kg).
- (LES//FOUO) Cocaine seizure amounts in sectors increased 54 percent in February
2010 (627 kg) compared with February 2009 (408 kg). Prior to this month, cocaine
seizure totals in sectors had not surpassed 600 kilograms since April 2009 (717
kg).
- (LES//FOUO) Cocaine seizure totals were highest in the McAllen (291 kg),
Laredo (188 kg), and San Diego (82 kg) Sectors, accounting for 90 percent of
the total amount seized in sectors. The amounts seized at the McAllen and Laredo
Sectors increased 32 percent and 355 percent, respectively, compared with February
2009, while the amount seized in the San Diego Sector decreased 42 percent during
the same period.
To Top
To Contents
Methamphetamine
YTD2010
- (LES//FOUO) In YTD2010, methamphetamine seizure totals along the Southwest
Border (581 kg) were 89 percent above the 2004-2010 average (308 kg). In fact,
the amount of methamphetamine seized was above average in all areas except the
Del Rio (100% below average) and Tucson (17% below average) Areas. (See
Drug Seizure
Status map.)
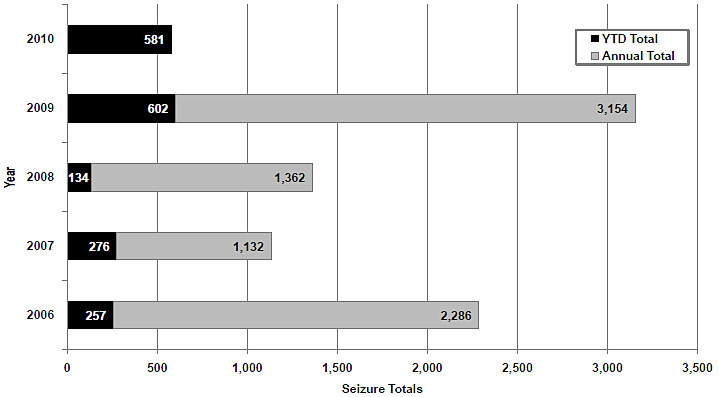
- (LES//FOUO) Methamphetamine seizure amounts in YTD2010 were slightly lower
than in YTD2009 (602 kg) but were more than double all other YTD totals since
2006--specifically, YTD2008 (134 kg), YTD2007 (276 kg), and YTD2006 (257 kg).
(See Chart 3 and
Table A.)
Chart 3. (LES//FOUO)
Methamphetamine Seizure Totals, Year-to-Date and Annual, in Kilograms, 2006-2010
- (LES//FOUO) The San Diego and El Centro Areas were the primary areas for
seizures in YTD2010. However, the amount seized in the San Diego Area in YTD2010
(283 kg) decreased 9 percent compared with YTD2009 (312 kg), while the amount
seized in the El Centro Area (76 kg) increased 37 percent compared with YTD2009
(56 kg). (See Table B.)
- (LES//FOUO) Seventy-two percent of the total amount of methamphetamine seized
at POEs in YTD2010 (450 kg) was seized at California POEs (323 kg). Officers
at the San Ysidro (152 kg), Otay Mesa (90 kg), and Calexico (67 kg) POEs seized
the most methamphetamine in YTD2010. (See
Table B.)
- (LES//FOUO) Methamphetamine seizure amounts in sectors decreased 21 percent
in YTD2010 (131 kg) compared with YTD2009 (166 kg). The Yuma Sector (48 kg)
was the primary sector for methamphetamine seizure amounts in YTD2010, accounting
for more than one-third of the amount seized. The amount seized in that sector
in YTD2010 was higher than all annual totals since 2006--specifically, 2009
(13 kg), 2008 (3 kg), 2007 (12 kg), and 2006 (1 kg). (See
Table B.)
February 2010
- (LES//FOUO) Methamphetamine seizure totals along the Southwest Border in
February 2010 (369 kg) were 93 percent above the January 2004-2010 average (191
kg). Methamphetamine seizures were above average in all areas except the Del
Rio and Laredo Areas, where February 2010 totals were 100 percent below average.
(See Drug
Seizure Status map.)
- (LES//FOUO) The amount of methamphetamine seized in February 2010 was slightly
lower than the amount seized in February 2009 (387 kg); however, the amount
was significantly higher than the amounts seized in February of 2008 (93 kg),
2007 (154 kg), and 2006 (145 kg). Seizure totals this month were also the highest
since May 2009 (393 kg).
- (LES//FOUO) Most methamphetamine seized in February 2010 was seized in the
San Diego (194 kg, or 53% of the total) Area. Methamphetamine seizures increased
the most in the El Centro (55 kg, a 270% increase) and Yuma (33 kg, a 203% increase)
Areas in February 2010 compared with February 2009, when 15 and 11 kilograms
were seized, respectively.
- (LES//FOUO) Methamphetamine seizure amounts at POEs increased 42 percent
in February 2010 (313 kg) compared with February 2009 (222 kg), while the amount
seized in sectors decreased 66 percent, from 165 kilograms in February 2009
to 56 kilograms in February 2010.
- (LES//FOUO) Sixty-eight percent of the methamphetamine seized at POEs in
February 2010 was seized at California POEs. Methamphetamine seizure amounts
at the San Ysidro (110 kg) and Calexico (45 kg) POEs accounted for 50 percent
of the methamphetamine seized at POEs along the Southwest Border this month.
Significant amounts of the drug were also seized at the Otay Mesa (43 kg), Nogales
(40 kg), and Hidalgo (37 kg) POEs in February 2010.
- (LES//FOUO) The San Diego Sector was the primary sector for methamphetamine
seizures in February 2010 (33 kg), accounting for 59 percent of the methamphetamine
seized between POEs. This was a substantial increase from February 2009, when
only 2 kilograms were seized in the sector.
To Top
To Contents
Marijuana
YTD2010
- (LES//FOUO) The amount of marijuana seized along the Southwest Border in
YTD2010 (246,551 kg) was 33 percent above the 2004�2010 average (185,135 kg).
Marijuana seizure totals were above average in all areas except the El Centro
(68% below average), El Paso (42% below average), and San Diego (12% below average)
Areas. (See
Drug Seizure
Status map.)
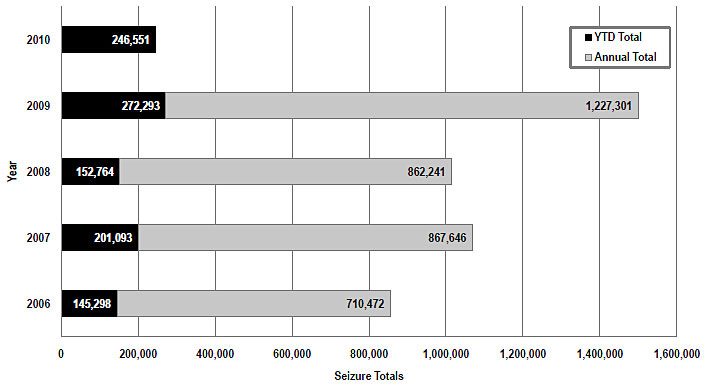
- (LES//FOUO) Marijuana seizure totals in YTD2010 were slightly lower than
in YTD2009 (272,293 kg) but were significantly higher than the amounts seized
in YTD2008 (152,764 kg), YTD2007 (201,093 kg), and YTD2006 (145,298 kg). (See
Chart 4 and
Table A.)
Chart 4. (LES//FOUO)
Marijuana Seizure Totals, Year-to-Date and Annual, in Kilograms, 2006-2010
- (LES//FOUO) Most marijuana was seized in the Tucson Area (92,403 kg, or
37% of total), followed by the McAllen Area (84,561 kg, or 34% of total) in
YTD2010.
- (LES//FOUO) Marijuana seized between POEs was seized primarily by agents
in the Tucson (86,131 kg, or 41% of total) and McAllen (82,934 kg, or 40% of
total) Sectors. The amount of the drug seized in the Tucson Sector decreased
16 percent from YTD2009 (102,117 kg) to YTD2010, while the amount seized in
the McAllen Sector increased 8 percent during the same period.
- (LES//FOUO) Marijuana seizure totals at POEs decreased 25 percent in YTD2010
(37,242 kg) compared with YTD2009 (49,593 kg). The Laredo POE (10,027 kg) was
the primary POE for marijuana seizures in YTD2010, accounting for 27 percent
of the total amount seized at POEs. Seizure amounts at the POE increased substantially,
surpassing all other YTD totals since 2006--specifically, 2009 (4,886 kg), 2008
(647 kg), 2007 (650 kg), and 2006 (2,306 kg). Seizures at the El Paso POE (4,151
kg), the primary POE for marijuana seizures since 2006, were the lowest since
2006--specifically, 2009 (12,851 kg), 2008 (13,434 kg), 2007 (11,968 kg), and
2006 (6,741 kg).
February 2010
- (LES//FOUO) The amount of marijuana seized along the Southwest Border in
February 2010 (131,996 kg) was 35 percent above the February 2004-2010 average
(97,623 kg). Marijuana seizure amounts were above average in all areas except
the El Centro (71% below average), El Paso (43% below average), and San Diego
(26% below average) Areas. (See
Drug Seizure
Status map.)
- (LES//FOUO) Total marijuana seizures decreased slightly in February 2010
compared with February 2009 (137,391 kg). (See
Table A.)
- (LES//FOUO) Most marijuana was seized in the Tucson (49,141 kg, or 37% of
total) and McAllen (48,478 kg, or 37% of total) Areas in February 2010. Decreases
in seizure amounts occurred in all areas except the Laredo (36% increase), McAllen
(25% increase), and Marfa (24% increase) Areas.
- (LES//FOUO) The amount of marijuana seized in sectors increased slightly
in February 2010 (115,225 kg) compared with February 2009 (113,060 kg). Seizure
amounts in the Tucson (45,913 kg) and McAllen (47,220 kg) Sectors accounted
for 81 percent of the total amount seized between POEs this month. Seizure totals
decreased in all sectors except the Marfa (40% increase), McAllen (23% increase),
and Laredo (20% increase) Sectors.
- (LES//FOUO) Marijuana seizure totals at POEs decreased 31 percent in February
2010 (16,771 kg) compared with February 2009 (24,331 kg). The Laredo POE (4,254
kg) was the primary POE for marijuana seizures in February 2010. This was the
third consecutive month in which seizures totaled more than 4,000 kilograms
at the POE, the others being December 2009 (4,892 kg) and January 2010 (5,773
kg). Monthly seizure amounts at the POE have exceeded 4,000 kilograms in only
five months since 2006.
To Top
To Contents
Table A. (LES//FOUO) Illicit
Drug Seizures Along the U.S. Southwest Border, in Kilograms
Drug
(For Month) |
February
2006 |
February
2007 |
Percent of Change February
2006 to February
2007 |
February
2008 |
Percent of Change February
2007 to February
2008 |
February
2009 |
Percent of Change February
2008 to February
2009 |
February
2010 |
Percent of Change February
2009 to February
2010 |
| 82,916 |
99,641 |
20 |
89,204 |
-10 |
137,391 |
54 |
131,996 |
-4 |
| 1,570 |
1,541 |
-2 |
1,274 |
-17 |
1,229 |
-4 |
1,265 |
3 |
| 145 |
154 |
6 |
93 |
-40 |
387 |
317 |
369 |
-4 |
| 32 |
22 |
-31 |
63 |
187 |
39 |
-38 |
109 |
178 |
| 84,663 |
101,358 |
20 |
90,634 |
-11 |
139,046 |
53 |
133,739 |
-4 |
Drug
(Year-to-Date) |
Year-to-Date 2006 |
Year-to-Date 2007 |
Percent of Change Year-to-Date 2006 to Year-to-Date
2007 |
Year-to-Date 2008 |
Percent of Change Year-to-Date 2007 to Year-to-Date
2008 |
Year-to-Date 2009 |
Percent of Change Year-to-Date 2008 to Year-to-Date
2009 |
Year-to-Date 2010 |
Percent of Change Year-to-Date 2009 to Year-to-Date
2010 |
| 145,298 |
201,093 |
38 |
152,764 |
-24 |
272,293 |
78 |
246,551 |
-9 |
| 2,845 |
3,216 |
13 |
2,354 |
-27 |
2,414 |
3 |
2,043 |
-15 |
| 257 |
276 |
7 |
134 |
-51 |
602 |
350 |
581 |
-4 |
| 51 |
60 |
17 |
85 |
42 |
67 |
-21 |
141 |
112 |
| 148,451 |
204,645 |
38 |
155,337 |
-24 |
275,376 |
77 |
249,316 |
-9 |
Source: U.S. Customs and Border Protection.
Note: Figures have been rounded and thus may not equal the totals and percentage
changes shown.
To Top
To Contents
Table B. (LES//FOUO) Primary Areas,
POEs, and Sectors for Drug Seizure Amounts in 2009 and YTD2010, in Kilograms
| |
Marijuana |
Cocaine |
Methamphetamine |
Heroin |
| 2009 |
YTD 2010 |
2009 |
YTD 2010 |
2009 |
YTD 2010 |
2009 |
YTD 2010 |
| Tucson |
607,338 |
Tucson |
92,403 |
McAllen |
3,849 |
McAllen |
591 |
San Diego |
1,650 |
San Diego |
283 |
San Diego |
235 |
San Diego |
69 |
| McAllen |
446,129 |
McAllen |
84,561 |
El Centro |
3,265 |
Laredo |
431 |
El Centro |
515 |
El Centro |
76 |
Tucson |
93 |
El Centro |
25 |
| Laredo |
128,984 |
Laredo |
26,085 |
San Diego |
1,610 |
El Centro |
320 |
McAllen |
348 |
Yuma |
63 |
McAllen |
89 |
Tucson |
17 |
| El Paso |
54,848 |
Laredo |
10,027 |
Calexico |
2,357 |
Calexico |
197 |
San Ysidro |
855 |
San Ysidro |
152 |
Otay Mesa |
128 |
San Ysidro |
48 |
| San Ysidro |
32,233 |
Otay Mesa |
5,044 |
Hidalgo |
1,247 |
Nogales |
171 |
Otay Mesa |
582 |
Otay Mesa |
90 |
San Ysidro |
90 |
Calexico East |
23 |
| Otay Mesa |
31,262 |
San Ysidro |
4,905 |
Nogales |
934 |
Laredo |
167 |
Calexico |
307 |
Calexico |
67 |
Nogales |
65 |
Laredo |
15 |
| Tucson |
563,177 |
Tucson |
86,131 |
McAllen |
1,921 |
McAllen |
473 |
San Diego |
190 |
Yuma |
48 |
McAllen |
52 |
San Diego |
7 |
| McAllen |
430,229 |
McAllen |
82,934 |
San Diego |
872 |
Laredo |
264 |
McAllen |
168 |
Laredo |
40 |
El Centro |
39 |
McAllen |
4 |
| Laredo |
101,240 |
Laredo |
16,058 |
Laredo |
822 |
San Diego |
133 |
Laredo |
48 |
San Diego |
33 |
San Diego |
17 |
Del Rio |
1 |
Source: U.S. Customs and Border Protection.
Note: The areas, POEs, and sectors in red changed rank in YTD2010 compared with
2009.
Footnotes
.
(U) Seizure totals are rounded and thus may not reflect the percentage changes shown.
.
(U) An area includes one sector but may include more than one Office of Field Operations
(OFO) of a U.S. Customs and Border Protection (CBP) office and multiple ports of
entry (POEs). Areas are depicted on the maps in
Appendix A using sector boundaries
and titles; however, the totals include both OFO POE and Office of Border Patrol
(OBP) sector seizure amounts. Sectors consist of areas between POEs.
To Top
To Contents
To Dissemination
To Publications
Page
To Home Page
LIMITED OFFICIAL USE-LAW ENFORCEMENT SENSITIVE//FOR OFFICIAL
USE ONLY
End of page.