 |
National Drug
Intelligence Center
National Drug Threat Assessment 2005 -
Executive Summary
February 2005
Cocaine
The threat posed to the United States by the trafficking and
abuse of cocaine is very high. Despite significant success in reducing worldwide cocaine production and
increasing cocaine seizures, cocaine remains readily available throughout the country. Moreover, the
demand for cocaine, although declining among most age groups, remains relatively high. In
fact,
National Survey on Drug Use and Health (NSDUH) data indicate that in 2003 more than 5.9 million persons
aged 12 or older had used cocaine within the past year.1
Trends and Developments
-
Key indicators show stable or slightly increased cocaine
availability in U.S. drug markets despite sharp decreases in the amount of cocaine transported
toward the United States from South America in 2003.
-
Use of powder and crack cocaine has decreased overall among
eighth, tenth, and twelfth graders since 1999. Powder cocaine use among young adults has increased
since 1999, while crack use has trended downward slightly.
Figure 2. Rates of Past
Year Use for Powder Cocaine,
1999-2004
d-link
Source: Monitoring the Future.
-
According to intelligence community estimates, potential
worldwide cocaine production has decreased sharply since 2001, primarily because of a 34 percent
decline in cocaine production in Colombia from 700 metric tons in 2001 to 460 metric tons in
2003.
Table 1. Andean Region Coca Cultivation,
in
Hectares,
and Potential Cocaine Production, in Metric Tons, (100% pure),
1999-2003
| |
1999 |
2000 |
2001 |
2002 |
2003 |
|
Net Cultivation (ha)
|
183,000 |
190,000 |
223,700 |
205,450 |
173,450 |
|
Potential Cocaine
Production (mt)
|
730 |
750 |
900 |
800 |
655 |
Source: Crime and Narcotics Center: Major
Narcotics-Producing Nations.
Table 2.
Cocaine Losses in Transit Toward the United States, in Metric Tons,
2002-2003
| Departed
South America Moving Toward US |
Lost or
Seized in Transit Toward US
| Seized in
US Arrival Zone
| Cocaine
Available to US Markets
|
| 2002
| 532* |
138 |
32 |
362 |
| 2003
| 422* |
157 |
32 |
233 |
Source: Interagency Assessment of Cocaine Movement, 2003.
* Unprecedented levels of eradication have
introduced an element of uncertainty to these estimates.
-
According to the Interagency Assessment of Cocaine Movement (IACM), an estimated 77 percent
of the cocaine detected moving toward the United States in 2003 was transported through the
Mexico-Central America corridor, an increase from 72 percent in 2002. Moreover, preliminary data
show that the percentage of cocaine detected moving toward the United States through the Mexico-Central America corridor may have been higher
than 90 percent in 2004.
Figure 3.
Cocaine Flows to the United States
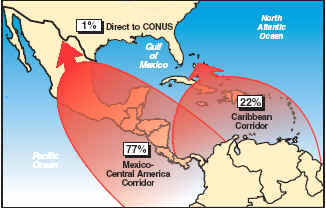
Source: Interagency Assessment of Cocaine Movement, 2003.
Boundary representations are not necessarily
authoritative.
-
Atlanta, Chicago, Los Angeles, Houston, Miami, and New York
are the cocaine PMAs because these cities have demonstrated very high levels of cocaine abuse
and are among the largest regional- or national-level cocaine distribution centers. Dallas
and Phoenix are national-level cocaine distribution centers, but cocaine abuse in these cities
is significantly lower than in many metropolitan areas. Cocaine consumption is very high in
Baltimore, Detroit, and Philadelphia; however, drug seizure data show relatively little cocaine
distribution from these cities to other significant drug markets.
To Top To
Contents
End Note
1. The NSDUH, formerly the National Household
Survey on Drug Abuse, a project of the Substance Abuse and Mental Health
Services Administration (SAMHSA) since 1971, is
the primary source of information on the use of illicit drugs, alcohol, and
tobacco by the civilian, non-institutionalized population
in the United States.
To Top To
Contents To Next Page
To Publications Page
To
Home Page
|