ARCHIVED
![]() To Contents To Previous Page
To Next Page To Publications Page
To Home Page
To Contents To Previous Page
To Next Page To Publications Page
To Home Page
 |
National Drug Intelligence Center National Drug Threat Assessment 2005 February 2005 Marijuana
Introduction and TrendsThe prevalence of marijuana and the continuing high demand for the drug underlie its stability as one of the foremost drug threats. More than 95 percent of state and local law enforcement agencies describe the availability of the most widely abused illicit drug as high or moderate, and 75 percent of illicit drug users aged 12 or older report current use of marijuana. The steady supply of and demand for marijuana overall and the strong, stable market for its distribution often allow for the financial stability of drug traffickers, many of whom traffic marijuana to bankroll other criminal activity, such as producing or distributing other illicit drugs like methamphetamine and cocaine. Marijuana sales yield high, steady profits for producers and distributors, yet the drug is relatively inexpensive for users. Nationally, the threat associated with marijuana trafficking has declined and lags behind that associated with methamphetamine and cocaine, including crack. According to NDTS data, the percentage of state and local law enforcement agencies identifying marijuana as their greatest drug threat has declined each year from 2002 to 2004 (20.4% to 13.1% to 12.0%). Moreover, current data indicate that the percentage of agencies identifying marijuana as their greatest drug threat is considerably less than the percentage identifying methamphetamine or cocaine (see Figure 3 in Scope and Methodology section). Such data indicate that despite the volume of marijuana trafficked and used in this country, for many in law enforcement marijuana is much less an immediate problem than methamphetamine, for example, which is associated with more tangible risks such as violent users and toxic production sites. Bearing this out, NDTS data also indicate that only 4.6 percent of state and local law enforcement agencies across the country in both 2003 and 2004 identified marijuana as the drug that most contributes to violent crime. Asked to identify the drug that most contributes to property crime, 9.5 percent of agencies nationwide identified marijuana in 2004, more than twice the response for violent crime, but less than reported in 2003 (11.8%). While trying to effectively allocate resources to combat marijuana in addition to other, more socially disruptive drugs, U.S. law enforcement is challenged to overcome the perception that marijuana is a drug that does little harm. In 2002 an estimated 94 million persons aged 12 or older reported trying marijuana or hashish at least once in their lifetime. Many of these users likely suffered no severe ill effects and have assumed from their unscathed experiences that marijuana use is harmless. For example, according to a 2003 news release from the Parents' Resource Institute for Drug Education (PRIDE), while 73 percent of nonusers believe marijuana is very harmful to one's health, only 11 percent of current users believe so. The perception that marijuana use is not harmful--common among users and shared to some extent among nonusers--is vital to ongoing local and state-level grassroots attempts to legalize marijuana under the guise of creating sensible law enforcement priorities and providing compassionate care for those with medical needs. Such views aside, in reality marijuana is not harmless. Marijuana's effects can include those problems attendant to cigarette smoking as well as problems with distorted perception and loss of coordination, which can contribute to household, occupational, or vehicular accidents. For example, in 2001 an estimated 38,000 U.S. high school seniors reported that they had crashed a vehicle while driving under the influence of marijuana. Other effects include problems with memory and learning, difficulty in thinking and problem solving, and increased heart rate. According to one study, fewer heavy users of marijuana completed college and more had household incomes of less than $30,000 as compared with a control group, despite similar educational and economic backgrounds. (In this study, heavy users smoked marijuana a mean of 18,000 times and no less than 5,000 times, while control group subjects smoked at least once but no more than 50 times in their life). NIDA reports that another study has indicated that a user's heart attack risk quadruples in the first hour after smoking marijuana. The production of marijuana also can harm the environment. The by-products of outdoor grows can potentially contaminate waterways or destroy vegetation and wildlife habitat through the use of chemical fertilizers and pesticides or from the trash and human waste left behind at large cultivation site encampments such as those on public lands. Outdoor cultivators also are known to start fires to clear timber or ground cover to prepare large sites. Indoor cultivation, too, can result in potentially harmful situations in areas surrounding the cultivation site, such as an increased risk of fire or electrocution posed by rewiring or jury-rigged electrical bypasses in grow houses and potential exposure to toxic molds that result from the high levels of relative humidity found in grow houses. AvailabilityThe escalating prevalence of higher potency marijuana such as sinsemilla appears to have resulted in an increase in average potency levels. Samples of marijuana testing at 9 percent or higher THC (delta-9-tetrahydrocannabinol) increased more than 600 percent from 1994 (104 of 3,281 samples) to 2002 (545 of 2,378 samples), according to data from the Potency Monitoring Project.13 Yet the increase in the average potency of tested marijuana and sinsemilla during that period was less dramatic. Average THC levels for both types rose approximately 50 percent, from 3.50 to 5.11 percent THC for marijuana and from 7.49 to 11.43 percent THC for sinsemilla. NDIC Comment: Marijuana potency has increased; however, it is unlikely that average potency levels will reach 20 or 30 percent THC in the near term. Even with the advances in indoor cultivation techniques or marijuana production methods used throughout the United States and Canada where much of the higher potency marijuana is produced, THC levels remain, typically, under 15 percent. Growers can and do produce marijuana with potency levels over 20 percent; however, not all growers have the capability or the determination either to produce top-quality marijuana or to achieve the highest potential yield from their crops. The trend toward larger grows controlled by organized crime groups in Canada and, to a lesser extent, in the United States should help stabilize or further slow the rise in average potency levels. The interests of DTOs and criminal groups are in marijuana's profitability, and they are unlikely to invest the care required to mass-produce top-quality marijuana, particularly in the drying, manicuring, and curing stages of production. Thus, average THC levels likely will continue to increase only gradually or remain relatively stable. DemandThe consequences of marijuana use evidenced in ED mentions and treatment admissions have increased steadily over the last decade. Marijuana-related ED mentions increased nearly 200 percent from 1994 to 2002. Marijuana-related treatment admissions increased 100 percent during the same period. NDIC Comment: The dramatic increases in marijuana-related ED mentions and treatment admissions often are viewed with concern, and while these increases may be attributable in part to the higher potency marijuana available today, this hypothesis has yet to be confirmed. Polydrug use and integrating treatment services in the disposition of minor cases of marijuana possession are two significant underlying factors to consider when assessing the consequences of marijuana use. Marijuana very often is used sequentially or concurrently with alcohol or other illicit drugs. In fact, only 28 percent of marijuana-related ED episodes in 2002 involved marijuana alone, so the presence of alcohol or other illicit drugs undoubtedly obscures the relevance of marijuana as a cause of many ED visits. Also, a rise in treatment referrals through the criminal justice system (such as through drug courts begun in the early 1990s) has contributed largely to the increase in marijuana-related treatment admissions. According to SAMHSA, treatment admissions referred by the criminal justice system were more likely to report marijuana as a primary substance of abuse than admissions referred by all other sources (24% vs. 10%). This is not to suggest that marijuana use is not harmful or that providing treatment as an alternative to arrest is a flawed policy, but these underlying factors do have bearing on analysis of marijuana's consequences. ProductionDomestic marijuana production appears to be increasing. Production estimates for the United States remain widely uncertain and there are as yet no agreed-upon trend data for comparison; however, law enforcement reporting indicates increasing cultivation throughout the country, noting in particular large-scale cultivation in the Pacific Region. NDIC Comment: Contributing to increasing domestic marijuana production is the rising involvement of DTOs and criminal groups in large-scale cultivation operations in the United States. For example, U.S.-based Mexican DTOs control large outdoor operations in California and Oregon, and law enforcement reporting further indicates that these DTOs are increasingly involved in commercial indoor cultivation in California's Central Valley. The establishment of Mexican DTO-controlled operations in the United States has been documented for a few years, and the U.S. Department of Agriculture (USDA) Forest Service reports that at least five separate Mexican DTOs currently are linked with cultivation operations on California public lands. Reporting suggests that Mexican DTOs set up operations within the United States to avoid increased border security and higher transportation fees after September 11, 2001. TransportationThe size of marijuana shipments smuggled from Canada into the United States has increased. Amounts smuggled overland across the Northern Border typically have ranged from personal use quantities to the 40- to 100-pound quantities carried in duffel bags; however, traffickers are increasingly transporting marijuana in private and commercial vehicles--for example, the trash trucks that frequently cross from Canada into Michigan--and overland shipments now are frequently 200 pounds or more. Also, marijuana shipments seized from noncommercial vessels and private aircraft in 2003 were two to three times larger than shipments seized from those transportation modes in previous years. NDIC Comment: The increase in the size of marijuana shipments smuggled from Canada is due largely to the increasingly commercial nature of marijuana production in Canada, which the RCMP reports is now dominated by organized crime, most notably Hells Angels and Vietnamese criminal groups. Typical cultivation operations in British Columbia and Ontario involve residential homes of 2,000-plus square feet that are totally converted to the grow operation, and RCMP reports that multithousand-plant operations are no longer uncommon. DistributionMiami appears to have diminished in its role as a national-level Primary Market Area; however, the South Florida area remains a primary entry point for foreign-produced marijuana smuggled through the Caribbean and is emerging as a regional source of supply for domestic marijuana. Law enforcement reporting and seizure data indicate that Florida, particularly the southern portion of the state, continues to be a focal point for maritime smuggling of marijuana from source areas such as Colombia and Jamaica. But in the past few years, as seizures specifically at the Port of Miami have declined, reporting indicates that shipments are entering the state at various points along its Atlantic Coast, particularly from Miami to Port St. Lucie, and at the southern tip. Also, indoor cultivation in South Florida has increased to such an extent in recent years that locally produced, usually hydroponic, marijuana is supplying not only a strong local market (Miami-Dade, Broward, Palm Beach Counties) but also markets out of state where it sells for a higher price. NDIC Comment: Except for reporting from law enforcement in markets along the East Coast that has cited Miami as a significant source of marijuana to their areas, there is little quantifiable data to show national-level wholesale distribution of marijuana specifically from Miami. Moreover, law enforcement in Florida believes that much of the marijuana produced locally or smuggled into the state, through the Caribbean or overland from Mexico, is consumed locally and that distribution of foreign or local marijuana from the area is not as significant. This situation is unlike that in Primary Market Areas such as Phoenix/Tucson or Chicago, for example, where reporting indicates that as much as half or more of the marijuana transported to those areas is destined for other markets.
AvailabilityGiven the consensus reporting from federal, state, and local law enforcement and public health agencies over many years, marijuana's widespread and ready availability in the United States is certain; however, the amount available remains less so. Preliminary interagency estimates suggest that anywhere from 12,000 to 25,000 metric tons of marijuana, including domestic and foreign, were available in the United States in 2002, up from an estimated 10,000 to 24,000 metric tons in 2001. These estimates are speculative. While current estimates are not precise, these ranges nevertheless underscore the magnitude of marijuana's availability in the United States and indicate that the amount available is increasing. All DEA Field Divisions and HIDTA offices report that marijuana is readily, widely, or the most available illicit drug in their areas. Reports of increased availability largely concerned higher potency or Canadian Bud (also referred to as BC (British Columbia) Bud) marijuana reported by Field Divisions and HIDTA offices whose jurisdictions include the northern half of the country. Such reporting likely implicates Canadian marijuana, although higher potency marijuana is produced domestically, particularly in the Pacific Region, and the term Canadian Bud has been used to identify any marijuana consisting of buds and is not necessarily an accurate indicator of the country of origin. Areas where increased marijuana availability was identified include Detroit, North Dakota, South Dakota, Oregon, Washington, New Hampshire, Vermont, Colorado, Utah, Montana, and Wyoming. There were no reports of a trend toward decreased availability, although DEA Newark attributed a recent shortage in marijuana supplies to law enforcement actions in late 2003. NDTS 2004 data show that 97.8 percent of state and local law enforcement agencies describe the availability of marijuana as high or moderate, little deviating from the percentages reported for 2003 (98.2%) and 2002 (96.9%). The percentage of agencies reporting high or moderate availability in 2004 ranged narrowly from a low of 97.1 percent in the Southeast to a high of 99.5 percent in the West. Although law enforcement agencies throughout the country identify marijuana as the most prevalent illicit drug in their areas, few consider it a significant threat to public health and safety, hence its relatively low ranking as the greatest drug threat. Another indication that marijuana's availability is not declining is that federal seizures of marijuana have increased slightly overall since 2001. As illustrated in Figure 25, however, while marijuana seizures have increased, the amounts seized over the 4-year period shown have not varied significantly, nor has the location of most federal seizures. FDSS data show that from 2000 to 2003, seizures in the four border states of Texas, Arizona, California, and New Mexico accounted for an average of 92 percent of all marijuana seized through incidents in which federal agencies participated. In 2004 seizures in Texas and Arizona alone accounted for 76 percent of total federal marijuana seizures.
Contrary to reports of increased availability and amounts seized, marijuana-related arrests have been declining, probably reflecting law enforcement's focus on more socially disruptive drugs, such as methamphetamine or crack, as well as the challenges posed by state and local laws inconsistent with federal laws governing marijuana. For example, the number of DEA arrests that involved marijuana declined overall from 7,096 in 2000 to 4,655 in 2003. At least 80 percent of DEA marijuana-related arrests in each year from 2000 through 2003 involved marijuana of foreign origin. Potency levels reflect less the actual supply of marijuana available than they do the quality available. Thus the documented rise in marijuana potency (see Table 10) is more a factor of the availability of and demand for better quality marijuana. For example, according to data from the Potency Monitoring Project at the University of Mississippi, 23 percent of submitted samples tested at 9.0 percent THC or higher in 2002, compared with just 3 percent in 1994 (when some 900 more samples were tested than in 2002). The data below also illustrate that despite advances in cultivation techniques that make it possible to produce marijuana with THC levels of 20 to 30 percent, yields of this strength are not the rule, and high potency marijuana--whether sinsemilla from Canada or the United States--more typically tests between 10 and 15 percent THC.
Marijuana prices typically are not a strong indicator of the drug's availability. Wide-ranging prices, such as those shown in Table 11, which illustrates wholesale price ranges in some specific primary marijuana markets in 2001 and 2003, indicate the availability of marijuana of varying quality, from commercial-grade (domestic outdoor grown or Mexico-produced) to sinsemilla (domestic indoor grown or Canada-produced). Marijuana prices also are wide-ranging because of factors such as the buyer-seller relationship, the quantity purchased, the purchase frequency, and the market's distance to the source. Table 11. Percentage of Past Year Use of Methamphetamine, by Population Density, 2003
DemandDemand is higher for marijuana than for any other illicit drug, and the constancy of this demand over time has ensured marijuana's ready availability and profitability. No less than 75 percent of illicit drug users in the United States aged 12 or older--an estimated 14.6 million persons--reported current use of marijuana in 2003. Such a sizable user population, encompassing persons of wide-ranging ages, both genders, and diverse origins residing in areas urban to rural, equates to steady profits. Past year marijuana use overall is relatively stable, generally showing modest, albeit not always significant, downward trends across most age groups. Conversely, the consequences of marijuana use seen in ED mentions and treatment admissions show no significant changes from year to year yet continue to rise steadily. Predominant User GroupsMTF prevalence data in the chart below clearly depict the pattern of marijuana use as an arc across the age groups with peak use typically occurring from the late teens through the late twenties (see Figure 26). Although comprising a larger population and different age groups, NSDUH data indicate a similar pattern of the highest rates of use occurring among young adults and adolescents. Past year use was highest in 2003 for those aged 18 to 25 (28.5%), followed by those 12 to 17 (15.0%) and 26 or older (6.9%)
National drug prevalence data indicate that rates of marijuana use are generally higher among males, although the gender gap is relatively even between the sexes among younger users and widens as marijuana users age. MTF adolescent data for 2003 show past year use was 13.9 percent for males and 11.5 percent for females among eighth graders, 30.0 and 26.4 percent among tenth graders, and 37.8 and 31.6 percent among twelfth graders. According to 2003 MTF data regarding adults, 30.7 percent of males and 24.4 percent of females aged 19 to 30 reported past year marijuana use. Likewise, NSDUH data for 2003 indicate a narrow gender gap between rates of past year use for males and females aged 12 to 17 (15.3% and 14.6%, respectively) that widened among those aged 18 to 25 (33.0% and 24.0%) and 26 or older (9.2% and 4.7%). Prevalence data further indicate that marijuana use is highest for Whites overall, particularly during years of peak use (late teens and early twenties). According to 2003 MTF data, while 19.1 percent of Hispanic eighth graders reported past year marijuana use compared with 13.0 and 12.6 percent of White and Black students, among older teens past year use was highest for Whites (30.6%), followed by Hispanics (28.8%) and Blacks (25.1%) in tenth grade; this pattern continued in twelfth grade with 37.9, 31.1, and 26.3 percent of Whites, Hispanics, and Blacks, respectively, reporting past year use. NSDUH 2003 data indicate that Whites were the primary marijuana users of these ethnic groups among adolescents and young adults as well. Among older adults, however, use among Blacks surpassed use among Whites (see Table 12).
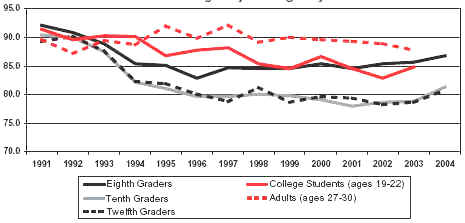
Marijuana is readily available across the country from large cities to small towns to rural areas; however, national prevalence data suggest that younger users have easier access to marijuana in less populated areas. According to 2003 MTF data, past year marijuana use was reported by 14.1 percent of eighth graders in Non-MSAs (areas having no town with a population of at least 50,000) compared with 11.5 percent of eighth graders in densely populated Large MSAs. This pattern was the same for tenth graders--higher reported use in Non-MSAs (29.0%) than Large MSAs (27.1%). Marijuana use started to shift by twelfth grade, however, when it was reported by slightly more students in Large MSAs (32.3%) than Non-MSAs (32.2%). Among adults aged 19 to 30, past year use was higher for those in a Very Large City than in Farm/Country areas (29.4% vs. 21.4%). NSDUH data also indicate higher reported marijuana use among young users in less populated areas and among adult users in urban areas. In 2003, 15.2 percent of adolescents in Non-Metro areas reported past year use compared with 14.4 percent in Large Metro areas. Among adults 26.9 percent of those aged 18 to 25 and 5.1 percent of those 26 or older in Non-Metro areas reported past year marijuana use compared with 28.4 and 7.4 percent, respectively, in Large Metro areas. Trends in Use Marijuana use among eighth, tenth, and twelfth graders as well as college students has declined each year since peaking in the late 1990s; however, declines have not been substantial enough to diminish overall high levels of demand. In fact, despite the recent declines, the prevalence of marijuana use among these age groups was still considerably higher in 2003 than in 1991, before rates of use began to rise. Use among young adults increased overall since 1991, not peaking until 2002. Figure 27 shows the general downward trend in adolescent use of marijuana. In fact, past year and current use for all three grades combined decreased nearly 11 percent from 2001 to 2003. The effects of an antimarijuana campaign launched in 2002 by the Office of National Drug Control Policy (ONDCP) may have bolstered overall declines in adolescent marijuana use, particularly reflected in the younger age groups as past year use decreased among eighth, tenth, and twelfth graders from 2001 to 2004. The latest NSDUH data show that the percentage of adolescents aged 12 to 17 reporting past year use of marijuana was 15.8 percent in 2002 and 15.0 percent in 2003. Figure 27 also shows relatively stable use among adults in recent years; no changes recorded in MTF data for any adult age group, including college students through those aged 40, were statistically significant. According to the latest NSDUH data, the percentage of adults aged 18 to 25 reporting past year use of marijuana decreased from 2002 (29.8%) to 2003 (28.5%), while the percentages for those aged 26 or older were 7.0 and 6.9 percent in those years.
Perceptions of UseSince 1991 the percentages of both adolescents and adults who perceive regular use of marijuana as harmful or who disapprove of smoking marijuana regularly have decreased overall, according to MTF data (see Figures 28 and 29). These data also effectively illustrate a pattern whereby the perception of risk or harm associated with marijuana use declines with age. Not insignificantly, this decline parallels the increase in marijuana use seen in older teens and young adults.
According to PATS data, the percentage of teens perceiving great risk in using marijuana regularly has been relatively stable over the past 4 years, with a range of 58 to 60 percent of sixth through twelfth graders reporting each year from 2000 to 2003. PATS data further indicate, however, that while nonusers of marijuana are much more likely to consider regular use as very risky (72% versus 25% for users), there have been recent declines in the proportions of both nonusers and noncurrent users who associate certain negative consequences (for example, dropping out of school or not getting into a good college) with marijuana use. Such declines suggest a relaxing of teens' attitudes toward marijuana, thus increasing their susceptibility to use of the drug. Trends in Consequences of UseMarijuana-related ED mentions and treatment admissions have continued to rise overall; however, a review of relevant data suggests that in recent years some consequences of marijuana use have trended downward. For example, while the total estimated number of ED mentions for marijuana increased significantly (23.9%) from 2000 to 2002, year-to-year increases during that time frame were statistically unchanged (see Figure 30). Also, more cities reported significant decreases than increases in marijuana-related ED mentions. ED mentions decreased significantly from 2000 to 2002 in Dallas (30.5%) and from 2001 to 2002 in Dallas (18.9%), Seattle (13.8%), Washington, D.C., (12.1%), and Chicago (11.5%). DAWN reporting cities with the steepest increases from 2000 to 2002 were Newark (75%) and St. Louis (62.6%); from 2001 to 2002 significant increases in ED marijuana mentions continued only in Newark (45.9%).
TEDS data show that marijuana-related treatment admissions, too, have increased markedly over time--from 5.9 percent of all drug-related admissions in 1992 to 15.1 percent in 2002. The biggest upswing during that time frame occurred from 1992 (5.9%) to 1997 (12.3%), however, suggesting that the rise in the proportion of marijuana-related admissions to all drug admissions has slowed in later years. ADAM data indicate that more adult male arrestees tested positive for marijuana than for any other drug and that the percentage increased overall between 2000 and 2003 from 40.9 to 44.1 percent. In 2003, 9 of 39 ADAM sites reported that 50 percent or more of adult male arrestees tested positive for marijuana compared with just 3 of 35 ADAM sites in 2000. Oklahoma City is the only ADAM site where more than half of male arrestees tested positive for marijuana each year from 2000 to 2003.
ProductionMarijuana production levels appear to be increasing despite continuing eradication efforts in this country and abroad. Law enforcement reporting and eradication data indicate increased cultivation in the United States, including increases in the size of large outdoor operations, often located on public lands and controlled by independent growers as well as U.S.-based Mexican DTOs, and in the number of small indoor operations, likely set up by various independent growers or criminal groups. Reporting particularly notes large-scale cultivation in the Pacific Region and increased indoor production in Florida as well as in many areas of the United States and Puerto Rico. Intensifying the situation are reports of increased production in Mexico and Canada. The United States is a significant consumer of the marijuana produced in these two neighboring source areas, where cultivation operations are largely the purview of major DTOs and organized crime. Domestic ProductionEstimating marijuana production has been acknowledged as an imprecise science; rough estimates based on available data and reasonable assumptions suggest that production in the United States could range from 6,000 to 19,000 metric tons annually. Most of this marijuana likely is produced outdoors, and considerable amounts are produced on public lands. One of the largest intelligence gaps in estimating domestic marijuana production concerns indoor cultivation. An accurate estimate of domestic indoor marijuana production remains infeasible largely because of the difficulty in detecting the operations and the lack of national data available. According to DEA, it is believed that state and local law enforcement agencies seize most indoor grow operations; thus, many go unreported to federal law enforcement.
The cultivation of cannabis plants in order to produce marijuana is extensive in certain areas, most notably in the Pacific and Southeast Regions, as evidenced by Domestic Cannabis Eradication/Suppression Program (DCE/SP) data presented in Table 13. Both outdoor and indoor cultivation are common in the Pacific Region, where Hawaii is well known for the quality and quantity of marijuana produced outdoors, Washington and Oregon are principal source areas for top quality marijuana produced indoors, and California is a leading source area for marijuana produced in both outdoor and indoor grows. In the Southeast, outdoor cultivation is predominant. Tennessee and Kentucky are the principal source areas in this region. These areas of extensive cultivation notwithstanding, marijuana production remains a nationwide problem. There are few communities where cannabis is not cultivated for either distribution or personal use.
NDTS data show that state and local law enforcement agencies report the presence of indoor and outdoor cannabis cultivation almost equally. But as illustrated in Table 14, while percentages have been similar since 2002, indoor cultivation was reported by more agencies for the first time in 2004. Hydroponic cultivation, although reported far less than general indoor cultivation, also appears to have increased over the last few years, likely resulting from information shared among growers and hydroponic materiel accessible via the Internet and print media. Not surprisingly the Pacific Region, which includes central and northern California, as well as Washington and Oregon, had the highest percentage of agencies reporting both indoor and hydroponic cultivation (86.2% and 59.2%, respectively), while the Southeast Region, which includes Tennessee and Kentucky, had the highest percentage reporting outdoor cultivation (85.4%).
A large portion of outdoor marijuana production in the United States occurs on the expansive yet secluded areas offered by public lands. As reported by the United States Department of Agriculture (USDA) Forest Service, use of such lands also allows marijuana producers to avoid most of the asset forfeiture problems associated with private lands. National forests in California, collectively, and the Daniel Boone National Forest in Kentucky, specifically, are the primary areas of cultivation (see Table 15). As was the case in 2002, 8 of the top 10 national forests for eradication in 2003 were in California, and 6 of the 8 California forests are located in the northern and central portions of the state. Public lands administered by the Department of the Interior (DOI) are no less vulnerable to marijuana producers seeking cultivation sites. Although eradication numbers have been consistently smaller than those for National Forest System (NFS) lands (refer to Table 15), reporting indicates that marijuana cultivation on DOI-administered lands has increased overall since the mid-1990s.
Producers of domestic marijuana are as varied as domestic cultivation operations, which range from outdoor plots to indoor grows, from a few plants grown for personal use (quality) to thousands mass-cultivated by DTOs or other criminal groups (quantity). Local independent growers or criminal groups producing marijuana typically reflect the general population of an area. For example, Cuban American producers normally are identified only in Florida, which has a large Cuban community. Accordingly, law enforcement reporting indicates that most marijuana producers across the country are Caucasians. DEA reports that producers of indoor-grown marijuana in particular are overwhelmingly Caucasians. U.S.-based Mexican DTOs continue to control large outdoor cultivation operations in California, predominantly on public lands. In fact, five separate Mexican DTOs have been identified as operating on NFS lands in California, one of which has operations in seven forests covering land in nine counties. An increase in U.S.-based Mexican DTO-controlled cultivation operations in California's Central Valley has elevated marijuana production in that area to levels normally associated with counties in Northern California. More than 90 percent of the plants eradicated under the state's Campaign Against Marijuana Planting (CAMP) program in Central Valley counties in 2003 are believed to have been produced in Mexican DTO-controlled operations. Such operations also have been identified on public lands in Oregon, Washington, Idaho, Utah, Arizona, Georgia, and Arkansas. Mexican DTOs usually employ undocumented aliens from Mexico or supply organization members to live in camps at grow sites and tend the plots. Foreign ProductionMexico has been the principal source area for U.S.-destined foreign marijuana for decades, and already high production levels escalated in 2003. An estimated 13,500 metric tons of marijuana were potentially produced in Mexico in 2003, 70 percent more than in the previous year. For perspective, annual marijuana production in Mexico, although rising steadily since 1999, averaged approximately 7,300 metric tons in the 4 years preceding. Reportedly contributing to the escalated production in 2003 were favorable rainfall patterns in the western Sierra Madre Mountains,14 throughout which small cultivation plots are scattered to avoid detection and eradication of the plants. Mexican DTOs control nearly all marijuana production in Mexico, and despite increased drug use in that country in recent years, most of the marijuana produced is believed to be destined for markets in the United States. Given the steep increase in estimated production, it is not surprising that reporting from U.S. law enforcement continues to indicate that marijuana produced in Mexico is the most widely available type. Current RCMP estimates of Canadian marijuana production are 800 to 2,000 metric tons. Seizure data and law enforcement reporting indicate that multiple metric tons of marijuana are smuggled from Canada into the United States annually. British Columbia has traditionally been the most prolific area for marijuana production; however, production in Ontario and Qu�bec now appears to be at levels similar to those reported in British Columbia (see Table 16).
Organized crime is more extensively involved in marijuana production in Canada than in the United States. The RCMP reports that, in general, OMGs control most large-scale outdoor and indoor hydroponic (without soil) operations, while Asian, primarily Vietnamese, criminal groups dominate indoor organic (soil-based) operations. Both groups are prominent in provinces where marijuana is produced extensively, but Hells Angels OMG is likely dominant in Qu�bec, where RCMP reports a trend toward outdoor grows. More revealing, however, is that Vietnamese criminal groups appear poised to be the dominant indoor marijuana producers in many of Canada's largest cities. According to one report, Vietnamese criminal groups already run nearly every sizable indoor cultivation operation in Vancouver and Toronto, and they are becoming increasingly competitive in Montreal and in the Calgary area.
Marijuana production in Colombia continues to be reported at 4,150 metric tons, a figure reported every year since 1996. The principal drug-producing regions in Colombia lie in the south central portion of the country, where well-established Colombian DTOs and, to some extent, terrorist insurgent groups likely control marijuana production. Potential marijuana production has not even been reported since 1997 for Jamaica, where drug traffickers traditionally have paid local farmers to plant and harvest cannabis for distribution in the United States, Canada, and Europe. Marijuana continues to be produced to some extent in Jamaica and shipments continue to be detected departing Jamaica; however, reporting indicates that marijuana from Jamaica has largely been displaced from these traditional export markets by the high quality marijuana produced locally in the United States, Canada, and Europe. Jamaica does remain the principal source area of hash oil smuggled to Canada, some of which transits the United States en route.
TransportationThe transportation of marijuana from foreign source areas to the United States, as well as the transportation of foreign and domestic marijuana within the United States, occurs overwhelmingly by land. Transportation also occurs by sea and air; however, smugglers continue to exploit the breadth of U.S. land borders with Mexico and Canada, transporting huge amounts of marijuana via official border checkpoints as well as countless unofficial crossing points. Moreover, law enforcement reporting indicates that marijuana smuggling across the Southwest and Northern Borders is increasing. Transporters of marijuana include DTOs, criminal groups, gangs, and independent smugglers and encompass many racial and ethnic groups. Mexican DTOs and criminal groups and Jamaican criminal groups are the prominent smugglers and transporters of marijuana from Mexico. Vietnamese and Chinese criminal groups and Caucasian traffickers are the primary transporters of marijuana from Canada. Other transporters identified include Hispanics, African Americans, Native Americans, street gangs such as Latin Kings and �eta, and OMGs such as Hells Angels and Gypsy Jokers. To the United StatesMarijuana smuggling into the United States via its borders with Mexico and Canada appears to have increased overall; however, the volume of marijuana seized along the Southwest Border dwarfs Northern Border amounts (see Table 17). The increase in seizures along the Northern Border is likely the result of not only increased marijuana production in and smuggling from Canada but also increased law enforcement efforts along that border and the improved capture of data relating to Northern Border seizures.
Law enforcement reporting and seizure data indicate that most of the marijuana smuggled across the Southwest Border is transported by Mexican DTOs and criminal groups through and between POEs primarily in Texas and Arizona, followed by California and New Mexico. Cross-border overland modes of transportation are primarily private and commercial vehicles such as privately owned or rental cars and tractor-trailers. Recreational vehicles, buses, and trains are used as well. Other cross-border transport methods used include mail and express mail services as well as couriers. Couriers hike marijuana through remote areas, walk it through tunnels dug under the border, wade across border waterways with marijuana-laden rafts, or transport the drug on horseback. EPIC seizure data show that the POEs accounting for most of the marijuana seized along the Southwest Border over the last 3 years are El Paso and Laredo in Texas and San Ysidro, Otay Mesa, and Calexico in California. Approximately 80 percent of the marijuana seized at Southwest Border POEs each year from 2001 to 2003 was seized at these five POEs. The counties accounting for most of the marijuana seized between Southwest POEs from 2001 through 2003 are Pima and Santa Cruz Counties in Arizona. The Texas counties of Starr and Hidalgo followed in 2001 and 2002, Zapata County in 2003. Between 50 and 60 percent of the marijuana seized between Southwest Border POEs each year from 2001 to 2003 was seized in these counties. Amounts seized in Pima and Santa Cruz Counties increased each consecutive year as law enforcement agencies along the Arizona-Mexico border reported an increase in marijuana trafficking (see Table 18).
Law enforcement reporting and seizure data indicate that most of the marijuana smuggled across the Northern Border is transported by OMGs such as Hells Angels, Vietnamese and Chinese criminal groups, and Caucasian, Native American, and Indian transporters through and between POEs primarily in Washington, followed by Michigan and New York. Cross-border overland means of transportation are primarily private and commercial vehicles. Recreational vehicles, buses, snowmobiles, and motorcycles also have been used. Other cross-border transport methods used include watercraft, aircraft (including airdrops), and couriers on foot. EPIC seizure data show that the POEs accounting for most of the marijuana seized along the Northern Border over the last 3 years are Blaine and Sumas in Washington. More than 50 percent of the marijuana seized at Northern Border POEs each year from 2001 to 2003 was seized at these two POEs. The counties accounting for most of the marijuana seized between POEs from 2001 through 2003 are Whatcom and Okanogan Counties in Washington. More than 70 percent, on average, of the marijuana seized between Northern Border POEs each year from 2001 to 2003 was seized in these two counties (see Table 19).
Looking at seizure data in terms of volume does portray the scale of marijuana smuggling across the Washington-British Columbia border, but this approach fails to illustrate the eastward expansion of marijuana smuggling across the Northern Border. Marijuana is now commonly smuggled into Michigan and New York as well as Idaho, Montana, North Dakota, and Vermont. Marijuana seizures have escalated, particularly in Michigan, where amounts seized increased 1,800 percent from 2001 to 2003. For perspective, however, it is important to remember that just one routine shipment seized on the Southwest Border can equal total annual seizures in Michigan or in Washington (approximately 2,200 kg and 7,020 kg, respectively, in 2003).
Marijuana smuggling by sea occurs far less than by land. Seizures from commercial and noncommercial vessels were relatively even in 2003 following declines in commercial seizures and increases in noncommercial seizures in the preceding 2 years. Commercial maritime seizures dropped steadily from 22,574 kilograms in 2001 to 9,471 kilograms in 2003, driven largely by an 86 percent decline in seizures in Miami over that period. Because most commercial maritime marijuana seizures involve containerized cargo, which is difficult to interdict without benefit of prior intelligence, such seizures are often sporadic, and the decline in commercial maritime seizures, such as in Miami, likely does not correlate with decreased use of commercial maritime means to smuggle marijuana. Indeed, Florida remains a prominent entry point for marijuana smuggled into the country from Jamaica, Colombia, and Mexico. EPIC seizure data show that the POEs accounting for most of the marijuana seized from commercial vessels over the last 3 years are primarily in Florida (Miami, Fort Lauderdale, West Palm Beach, Tampa). POEs in South Carolina (Charleston, Wando), and New Jersey (Gloucester City, Port Elizabeth, Newark) followed. Law enforcement and intelligence reporting indicate that the use of noncommercial vessels to smuggle marijuana is increasing and is a particularly common method along the Atlantic and Gulf Coasts of Florida, around South Padre Island in Texas, in the San Juan Islands in Washington, and on the St. Lawrence River between New York and Ontario. EPIC seizure data show that marijuana seizures from noncommercial vessels increased overall from 5,539 kilograms in 2001 to 9,660 kilograms in 2003. Seizures occurred most often in Florida (Dade, Monroe, Palm Beach, Broward, and Orange Counties), Texas (Cameron, Willacy, and Nueces Counties), and Washington (San Juan, Whatcom, and Skagit Counties). Of note, shipments seized from noncommercial vessels in Washington in 2003 were two to three times larger than in 2001. Marijuana smuggling by air appears to be the least used method. Commercial air seizures have been relatively consistent and low over the last 3 years, while seizures from private aircraft, typically low as well, have dropped precipitously. Commercial air seizures held relatively steady from 2001 to 2003, declining less than 3 percent overall during that period (2,352 kg to 2,291 kg). According to EPIC seizure data, the POE accounting for most of the marijuana seized from commercial air over the last 3 years is New York. POEs in the U.S. interior--Memphis, Cincinnati, and Louisville (all hubs for major commercial express mail services)--collectively accounted for the next highest amount, and seizures at these POEs have trended upward. Other POEs for commercial air marijuana seizures were in the border states of Florida (Miami, Fort Lauderdale), California (Los Angeles), and Texas (El Paso, Guthrie, San Antonio).
Marijuana smuggling by private air appears to have declined dramatically in terms of volume, and use of this method appears to have shifted from Florida to the Northern Border. EPIC seizure data show that marijuana seizures from private aircraft decreased from 1,730 kilograms in 2001 to 159 kilograms in 2003. In 2001 most marijuana seizures from private air (2 of 3) occurred in Florida (Dade and Citrus Counties). But all four seizures in 2002 occurred in Washington (Blaine, Whatcom, Skagit, and Spokane Counties), and the sole recorded private air seizure in 2003 occurred in Wisconsin (Washington County). Additionally, the one shipment in 2003 (159 kg) nearly equaled the total weight of the four shipments seized in 2002 (169 kg)--another indicator of the larger marijuana shipments smuggled from Canada. In the United StatesInside the United States marijuana is transported overland via interstates and other secondary roadways to cities and towns throughout the country including the Primary Market Areas of Chicago, Dallas, Houston, Los Angeles, Miami, New York, Phoenix/Tucson, San Diego, and Seattle. Private and commercial vehicles such as cars, pickup trucks, minivans, and tractor-trailers are the most common overland modes of transportation. Other transport methods used within the United States are mail and express mail services, trains, air cargo and, to a much lesser extent, aircraft. Methods of concealing marijuana transported via U.S. roadways vary to some extent by vehicle type. EPIC seizure data suggest that cars are the most identified mode of marijuana transport on the nation's roadways and that in most cases in 2003 seized marijuana was found in the car's trunk, sometimes inside a duffel bag or luggage in the trunk. In most seizure events involving tractor-trailers the marijuana was found in the trailer, often concealed in cargo or in false compartments. Law enforcement reporting indicates that concealment behind a false wall in the front of the trailer has been encountered frequently over the past year. Concealment in trucks, sport-utility vehicles, and vans appears to trend more toward false compartments, spare tires, gas tanks, or other recesses such as quarter panels, consoles, and doors. The use of buses to transport marijuana appears to have increased over the past year; in most of the seizures involving buses, the marijuana was concealed in duffel bags or luggage. Law enforcement reporting and seizure data indicate that mail and express mail services are second only to land conveyances in marijuana transportation. Contrary to law enforcement reporting that transporting marijuana via parcels has increased since September 11, 2001, and continues to grow, data from the U.S. Postal Inspection Service show a steady decline in the number of marijuana parcels as well as the total weight seized since 2000. It is reasonable to assume, however, that traffickers are more likely to use commercial rather than federal and express mail services, and express mail is identified in the majority of mail seizure events recorded in EPIC seizure data. Such data also show that the number of express mail marijuana seizure events and the total weight seized increased from 2002 to 2003. Reports of marijuana transportation by train are increasing; however, use of this method remains relatively infrequent overall. Reporting from several DEA Field Divisions and HIDTA offices in the Southwest, Pacific, Midwest, and Northeast Regions now indicates some transportation of marijuana by train or seizures from railcars or train passengers. EPIC seizure data also show that marijuana seizures from trains increased from 2002 to 2003; however, the number of seizure incidents remains comparatively low. As with the smuggling of marijuana by air into the country, transport of marijuana by private or commercial air within the country is limited. Neither law enforcement reporting nor seizure data suggest that use of this method will increase in the near term. In fact, law enforcement reporting indicates that even the transportation of marijuana to Puerto Rico via couriers on aircraft has declined, while the use of express mail services has increased.
DistributionThe market for marijuana is strong and stable throughout the United States and should remain so given the drug's wide appeal to users and consistent profitability for distributors as well as producers. As in years past marijuana distribution ranges from sales conducted at urban open-air drug markets to hand-to-hand exchanges between friends. Packaging remains consistent, too, with wholesale-level compressed bricks of usually Mexican marijuana wrapped in cellophane, 1-pound quantities of domestic or Canadian marijuana in vacuum-sealed plastic bags, and retail-level marijuana most often packaged in small resealable plastic bags. In many areas, drug distributors sell marijuana along with other drugs such as methamphetamine, crack cocaine, and heroin. Most DEA Field Divisions and HIDTA offices identify Mexican DTOs or criminal groups either as the primary marijuana wholesalers or as prominent in wholesale marijuana distribution in their areas, which take in every region of the United States. Jamaican criminal groups are primary or prominent wholesalers mainly in the Northeast in such cities as New York, Philadelphia, Boston, and Washington, D.C. Caucasian wholesale marijuana distributors are identified primarily in the Pacific, West, Southeast, and Northeast Regions and particularly in Kentucky, Tennessee, Oregon, and Washington. Vietnamese wholesale distributors are most active in the Pacific Region, although they have been identified in areas of the Midwest and Southeast Regions. Other wholesale marijuana distributors identified in various areas of the country include African Americans, Hispanics, Native Americans, and Pacific Islanders as well as members of traditional organized crime, street gangs, and OMGs. Midlevel marijuana distribution is dominated less by large trafficking organizations and more by criminal groups, street gangs, local independent dealers, and OMGs. According to DEA and HIDTA reporting, Jamaican criminal groups are prominent midlevel distributors, particularly in New York and to some extent in Philadelphia. Local Caucasian criminal groups dominate production as well as all levels of marijuana distribution in Kentucky, Tennessee, and throughout Appalachia. Mexican or other Hispanic criminal groups are active in midlevel distribution in every region of the country. Street gangs (usually identified as Hispanic or African American), local independent dealers (most often Caucasian), and OMGs are identified as midlevel marijuana distributors throughout the country to varying degrees. Many midlevel distributors of diverse ethnicity or group affiliation travel to Primary Market Areas or other large cities to purchase marijuana that they in turn distribute in their home communities. The retail distributors of marijuana are much the same as midlevel distributors, although local independent dealers and street gangs are more prevalent at the retail level overall. Local independent dealers, including those who produce their own marijuana through indoor or outdoor grow operations, distribute at the retail level throughout the country but are more prominent in suburban and rural areas. Local independent dealers typically are identified as Caucasian but also include Jamaican, African American, Hispanic (including Mexican), and Asian distributors. Street gangs such as Gangster Disciples, Vice Lords, Latin Kings, and Bloods are more prominent in urban areas. Other retail distributors include prison gangs in the Southwest Region; Vietnamese criminal groups or gangs in the Pacific Region, Colorado, and northern Florida; Pacific Islander criminal groups in Hawaii; and Native American dealers primarily in the West and Northeast Regions. NDTS data substantiate the heavy involvement of street gangs in marijuana distribution, particularly in the western half of the country. In 2004, 32.9 percent of state and local law enforcement agencies nationwide reported that street gang involvement in marijuana distribution was high or moderate, unchanged from the percentage reporting in 2003 and the highest reporting for any specific drug. Regionally, street gangs are a larger presence in marijuana distribution in the western United States. In 2004 the percentage of agencies that indicated high or moderate street gang involvement in marijuana distribution was highest for those in the Southwest (45.8%) and Pacific Regions (44.4%). Reporting was lowest in the Northeast at 22.4 percent of agencies. NDTS data further show that OMGs are involved in marijuana distribution to a lesser degree overall but are likewise most prominent in the western half of the country. In 2004, 15.3 percent of state and local law enforcement agencies nationwide reported that OMG involvement in marijuana distribution was high or moderate, up from 14.1 percent reporting in 2003 and second only to methamphetamine in both years. Regionally, the percentage of agencies that indicated high or moderate OMG involvement in marijuana distribution in 2004 was highest for those in the Pacific (22.9%) and West Regions (18.5%). Reporting was lowest in the Southeast at 12.9 percent of agencies. Primary Market AreasPrimary Market Areas for marijuana include Chicago, Dallas, Houston, Los Angeles, Miami, New York, Phoenix/Tucson, San Diego, and Seattle. These were determined based on the level of distribution through these markets and, in some cases, the type(s) of marijuana distributed. Use was not a determining factor for any marijuana Primary Market Area. The vast majority of foreign-produced marijuana is transported in bulk via the Southwest Border; consequently, marijuana shipments from markets such as Dallas, Houston, Los Angeles, San Diego, and Phoenix/Tucson are more frequent and often larger. Moreover, seizure data regarding the Southwest Border are the most comprehensive and corroborate extensive law enforcement reporting regarding distribution from these areas. Limiting the discussion to the southwestern United States based on the volume of marijuana distributed, however, would provide an incomplete picture. While the volume of marijuana distributed through Chicago, Miami, New York, and Seattle is small compared with markets in the southwestern United States, these markets typically have played an important role in distribution, particularly of marijuana smuggled across the Northern Border, smuggled through the Caribbean, or produced domestically. Shipments of marijuana transported to Primary Market Areas usually are delivered to stash houses which, as in Phoenix, often hold 500- to 1,500-pound lots at any given time. At these stash houses, the marijuana is divided into midlevel or retail quantities and repackaged for local, regional, or national distribution. Chicago. Mexican DTOs and criminal groups are the principal wholesale distributors in Chicago. Street gangs are the principal retail distributors, although they also are involved in some wholesale distribution. Gangster Disciples and Vice Lords control distribution on the west and south sides of Chicago where most open-air drug markets are located. Latin Kings distribute on the north and southeast sides and, according to the Chicago HIDTA, also cultivate cannabis locally. Local independent dealers also cultivate cannabis and distribute marijuana at the retail level. The largest cultivation operations in the metropolitan area have been set up on public lands, mainly in forest preserves. Some law enforcement estimates indicate that approximately half the bulk marijuana transported to the Chicago area is destined for other markets, most often cities in the Midwest and Southeast Regions such as Detroit, Minneapolis, and Memphis. Combined 2002 and 2003 EPIC Pipeline, Convoy, and Jetway data show that law enforcement reported 12 marijuana seizure events in which Chicago was identified as the city of origin. More than half the shipments seized were less than 1 kilogram; the three largest seizures, ranging from 9 to 45 kilograms, were destined for cities in Florida, Illinois, and Michigan. One explanation for the smaller amounts of marijuana seized coming out of Chicago is that many midlevel and retail dealers from areas surrounding the city make frequent trips to the Chicago area, where bulk amounts of marijuana typically are warehoused, to purchase or take delivery of smaller amounts for distribution in their home communities. Dallas. Mexican DTOs and criminal groups are the primary marijuana wholesalers in Dallas. Mexican criminal groups are also retail distributors; however, no single group dominates at the retail level. In Dallas, street gangs such as Mara Salvatrucha, Latin Kings, and Vice Lords distribute retail-level marijuana, as do Mexican, Caucasian, Hispanic, and Asian criminal groups and local independent dealers. Local independent dealers and Asian criminal groups produce limited quantities of marijuana locally. Much of the marijuana transported to Dallas is destined for markets primarily in the Midwest, Southeast, and Northeast Regions. According to EPIC Pipeline, Convoy, and Jetway data, law enforcement reported more than 50 marijuana seizure events in which Dallas was identified as a city of origin in 2003, compared with approximately 90 in 2002. In 2003 only Phoenix/Tucson, Los Angeles, and Houston were identified as cities of origin more than Dallas. Nearly 20 seizure events in which Dallas was identified as a city of origin involved shipments of more than 50 kilograms over both years. Some of the larger, more frequent destinations of marijuana shipments recorded in drug seizure data include Atlanta, Cincinnati, Kansas City (MO), Louisville, Memphis, Shreveport (LA), and Tulsa. Houston. Mexican DTOs and criminal groups are also the primary marijuana wholesalers in Houston. Mexican criminal groups also distribute at the retail level as do street gangs such as Gangster Disciples, Latin Kings, and Vice Lords, Asian criminal groups, and local independent dealers. Indoor production of marijuana, although still not widespread in the Houston area, appears to be increasing; law enforcement reporting has indicated the involvement of Asian criminal groups in hydroponic grows. Marijuana transported to Houston is destined for markets in the Midwest, Southeast, and Northeast Regions. Law enforcement reporting has indicated that the level of distribution through the South Texas area to southeastern states, particularly those along the Gulf Coast, has increased notably in the past few years. According to EPIC Pipeline, Convoy, and Jetway data, law enforcement reported approximately 100 marijuana seizure events in which Houston was identified as a city of origin in both 2002 and 2003. In 2003 only Phoenix/Tucson and Los Angeles were identified as cities of origin more than Houston. Nearly 30 seizure events in which Houston was identified as a city of origin involved shipments of more than 50 kilograms over both years. Some of the larger, more frequent destinations of marijuana shipments recorded in drug seizure data include Atlanta, Baltimore, Baton Rouge (LA), Chicago, Jackson (MS), Kansas City (MO), Louisville, and New Orleans. Los Angeles. Most wholesale marijuana distributed in Los Angeles is domestically produced and distributed by local independent distributors. Mexican traffickers are the principal wholesale distributors of Mexico-produced marijuana in Los Angeles. Jamaican traffickers in the area also distribute wholesale Mexican marijuana, often supplying Jamaican criminal groups in the eastern United States. Other wholesalers include street gangs, OMGs, and Asian distributors. Street gangs such as Bloods, Crips, 18th Street, and Mara Salvatrucha dominate retail distribution. Local independent dealers, including those who usually produce marijuana in small-scale grow operations (Caucasians, Hispanics, and Asians), also distribute at the retail level. Much of the foreign and domestic marijuana distributed through Los Angeles is destined for other markets in the Northeast, Southeast, and Midwest Regions. EPIC Pipeline, Convoy, and Jetway data indicate that law enforcement reported approximately 140 marijuana seizure events in which Los Angeles was identified as a city of origin in 2003, compared with more than 150 in 2002. In 2003 only Phoenix/Tucson was identified as the origin of marijuana shipments more than Los Angeles. Approximately 40 seizure events in which Los Angeles was identified as a city of origin involved shipments of more than 50 kilograms over both years. Some of the larger, more frequent destinations of marijuana shipments recorded in drug seizure data include Baltimore, Charlotte, Chicago, Memphis, Minneapolis, New York/Newark, San Juan, Washington, D.C., and cities throughout Florida. Miami. Wholesale and retail marijuana distributors in Miami are usually Hispanic (including Colombian, Cuban, Dominican, and Puerto Rican), Haitian, or African American. Cuban American criminal groups and independent cultivators often run indoor, usually hydroponic, cultivation operations and distribute the marijuana that they produce. Marijuana distributed from Miami typically is destined for markets along the East Coast. Combined 2002 and 2003 EPIC Pipeline, Convoy, and Jetway data show that law enforcement reported 12 marijuana seizure events in which Miami was identified as the city of origin. Only two seizure events involved marijuana shipments of more than 50 kilograms; both occurred in 2002. According to law enforcement reporting and drug seizure data, destinations of marijuana shipments distributed from Miami include New York, Philadelphia and various cities in Virginia, the Carolinas, and Florida. Indoor cannabis cultivation in the Miami-Dade area has increased in recent years to such an extent that limited quantities of the high potency marijuana produced locally have been distributed outside the area to New York, Massachusetts, Georgia, the Carolinas, and the Bahamas. New York. Jamaican criminal groups are the most prominent marijuana distributors overall, particularly for wholesale and midlevel quantities; however, no single group dominates any distribution level. Persons associated with traditional organized crime and Mexican traffickers also are involved in wholesale and midlevel marijuana distribution. Retail distributors include street gangs such as Bloods and Latin Kings, Jamaican criminal groups, and local independent dealers of diverse ethnicities. OMGs distribute primarily in outlying areas. Marijuana distributed from New York is destined primarily for markets along the East Coast, although seizure data do record some incidents of marijuana shipments moving from New York to the West Coast. Combined 2002 and 2003 EPIC Pipeline, Convoy, and Jetway data show that law enforcement reported 20 marijuana seizure events in which New York or one of the city's five boroughs was identified as the city of origin. Only three seizure events involved marijuana shipments of more than 50 kilograms over both years. According to drug seizure data, destinations of marijuana shipments distributed from New York include Baltimore, Charlotte (NC), Houston, Roanoke (VA), West Palm Beach, Charlotte Amalie in the U.S. Virgin Islands, and various smaller towns in New York State. Phoenix/Tucson. Mexican DTOs and criminal groups are the principal wholesale distributors in both cities. Jamaican criminal groups are prominent wholesalers in Phoenix, often supplying Jamaican distributors in the eastern United States. Retail distributors in the area include street gangs such as Wetback Power 21st Street in Phoenix and South Park Family Gangsters in Tucson, as well as Caucasian, Jamaican, Hispanic, and African American criminal groups or local independent dealers, and OMGs. Local independent dealers from other areas of Arizona and from outside the state frequently travel to Phoenix to purchase marijuana for their own use and for small-scale retail distribution in their home communities. Local production of marijuana in Phoenix/Tucson is relatively limited. Most of the marijuana distributed through Phoenix/Tucson is destined for markets primarily in the Midwest, Southeast, and Northeast Regions. EPIC Pipeline, Convoy, and Jetway data indicate that law enforcement reported nearly 350 marijuana seizure events in which either Phoenix or Tucson was identified as a city of origin in 2003, more than any other Primary Market Area and more than twice the number of events in 2002, when either Phoenix or Tucson was identified as a city of origin in approximately 150 marijuana seizure events. Almost 100 seizure events in which either Phoenix or Tucson was identified as a city of origin involved shipments of more than 50 kilograms over both years. Some of the larger, more frequent destinations of marijuana shipments recorded in drug seizure data include Atlanta, Baltimore, Chicago, Detroit, Indianapolis, Miami, New York/Newark, Philadelphia, and Washington, D.C. San Diego. Mexican traffickers are the principal wholesale distributors of Mexico-produced marijuana in San Diego. Jamaican traffickers in the area also distribute wholesale Mexican marijuana, often supplying Jamaican criminal groups in the eastern United States. Other wholesalers include street gangs, OMGs, and Asian distributors. Street gangs such as Black Mob, Neighborhood Crips, Lomas, and Diablos dominate retail distribution. Local independent Caucasian and Hispanic dealers, including those who usually produce marijuana in small-scale grow operations, are retail distributors as well. Much of the foreign and domestic marijuana distributed through San Diego is destined for other markets, primarily those in the Northeast, Southeast, and Midwest Regions. EPIC Pipeline, Convoy, and Jetway data indicate that law enforcement reported nearly 50 marijuana seizure events in which San Diego was identified as a city of origin in 2003, compared with more than 100 in 2002. In 2003 only Phoenix/Tucson, Los Angeles, Houston, and Dallas were identified as the origin of marijuana shipments more than San Diego. Fewer than 20 seizure events in which San Diego was identified as a city of origin involved shipments of more than 50 kilograms over both years. Some of the larger, more frequent destinations of marijuana shipments recorded in drug seizure data include Atlanta, Baltimore, Louisville, the New York/Newark metropolitan areas, Philadelphia, and St. Louis. Seattle. Wholesale marijuana distributors in the Seattle area include Caucasians, Hispanics, Vietnamese, and OMGs. Wholesalers of locally produced marijuana are usually Caucasian local independent dealers/producers. Caucasian and Vietnamese criminal groups and OMGs are the primary wholesalers of Canadian marijuana. Mexican criminal groups distribute wholesale Mexican marijuana. Retail marijuana distributors include Caucasian, Hispanic, Asian, and African American independent dealers as well as street gangs such as 74 Hoover Crips, Black Gangster Disciples, and Varrio Locos. Marijuana distributed through Seattle appears destined for various markets throughout the country. Combined 2002 and 2003 EPIC Pipeline, Convoy, and Jetway data show that law enforcement reported nine marijuana seizure events in which Seattle was identified as the city of origin. Only two seizure events involved shipments of more than 50 kilograms; both occurred in 2003, suggestive of the increasingly larger marijuana shipments smuggled across the Northern Border. According to drug seizure data, destinations of marijuana shipments distributed from Seattle include Chicago, Denver, Honolulu, Houston, St. Louis, and Washington, D.C. Additional destinations identified through law enforcement reporting include Florida, Minnesota, Montana, Nevada, North Carolina, and Virginia.
OutlookMarijuana production within the United States should increase as DTOs and criminal groups continue to establish or expand large-scale domestic cultivation operations. In addition, local independent growers in many of the principal U.S. production areas will continue to exploit state medical marijuana initiatives that permit cultivation, while others will start or continue to produce their own marijuana, aided by information and equipment available locally and via the Internet. The flow of marijuana across U.S. borders will increase, particularly from Mexico, given estimates of a 70 percent increase in marijuana production in that country in 2003. While it is unlikely that all the increased production will make it to U.S. markets, marijuana smuggling and seizures at the Southwest Border should only intensify in 2004. Law enforcement reporting from the Southwest Border indicates that as cross-border marijuana smuggling has increased, so too has the frequency of violent incidents, again a situation that should only intensify with increased production in and smuggling from Mexico. Reporting further indicates a trend toward increased armed confrontations between law enforcement and marijuana growers, particularly in California, resulting in 2003 being cited as the most violent year in the 20-year history of that state's eradication program. In addition, DCE/SP data indicate that the number of weapons seized during outdoor and indoor eradication operations nationwide has trended upward, rising nearly 30 percent from 2001 to 2003. Other harmful situations in which residential homes are rendered unsafe or uninhabitable because of damage caused by marijuana grow operations are likely to increase in areas like Florida where indoor cultivation continues to increase. An increased supply of marijuana likely will result in increased exposure to the drug and consequently more new users, since initiates to drug use are more likely to start with a drug that is as readily available and easily obtainable as marijuana. Indeed, reporting from some areas has suggested that marijuana is easier for youths to obtain than alcohol or cigarettes. Among established users, particularly among older teens and young adults, the general softening of attitudes regarding the risks associated with and the disapproval of marijuana use, combined with increased availability of the drug, should presage a rise in consumption. End Notes 13. The Potency Monitoring Project
analyzes samples of marijuana seized by federal and state law enforcement
agencies. The Project is funded by NIDA and is conducted at the University of
Mississippi. |
|||||||||||||||||||||||||||||||||||||||||||||||||||||||||||||||||||||||||||||||||||||||||||||||||||||||||||||||||||||||||||||||||||||||||||||||||||||||||||||||||||||||||||||||||||||||||||||||||||||||||||||||||||||
End of page.